Figure 6.

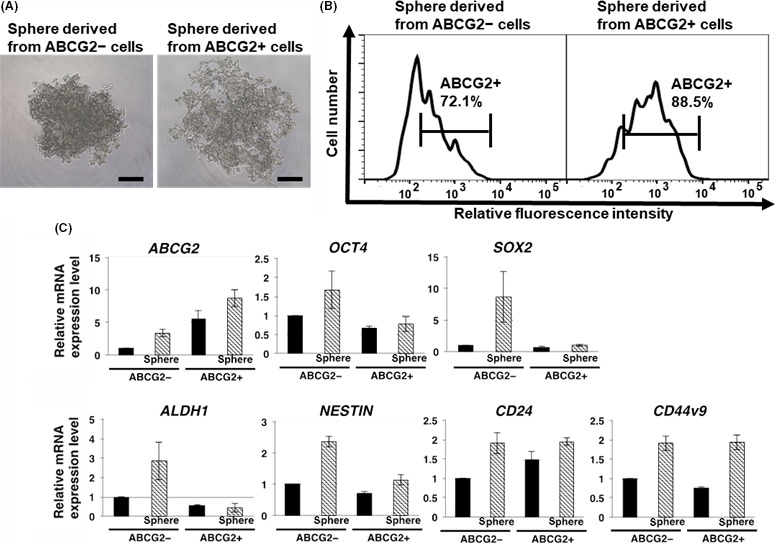
Comparison of stemness in spheres derived from ABCG2− and ABCG2+ adherent cells. A, ABCG2− cells formed a solid sphere including core‐like structure, while ABCG2+ cells formed a sphere with loose adhesion without core‐like structure. Phase contrast images. Scale bar = 250 μm. B, Levels of ABCG2 in ABCG2− and ABCG2+ cells after sphere formation as described in the Materials and Methods were analyzed by flow cytometry. Spheres from ABCG2− adherent cells showed high percentage of ABCG2+ cells. Representative results are shown. The gate represents ABCG2 positive cells. C, Quantitative RT‐PCR analysis showed that the spheres from ABCG2− adherent cells exhibited marked increase in all cancer stem cells (CSC) markers examined. The results are shown after normalization to the values obtained for ABCG2− adherent cells before sphere formation (value = 1). Results are presented as means ± SD from 3 independent experiments
