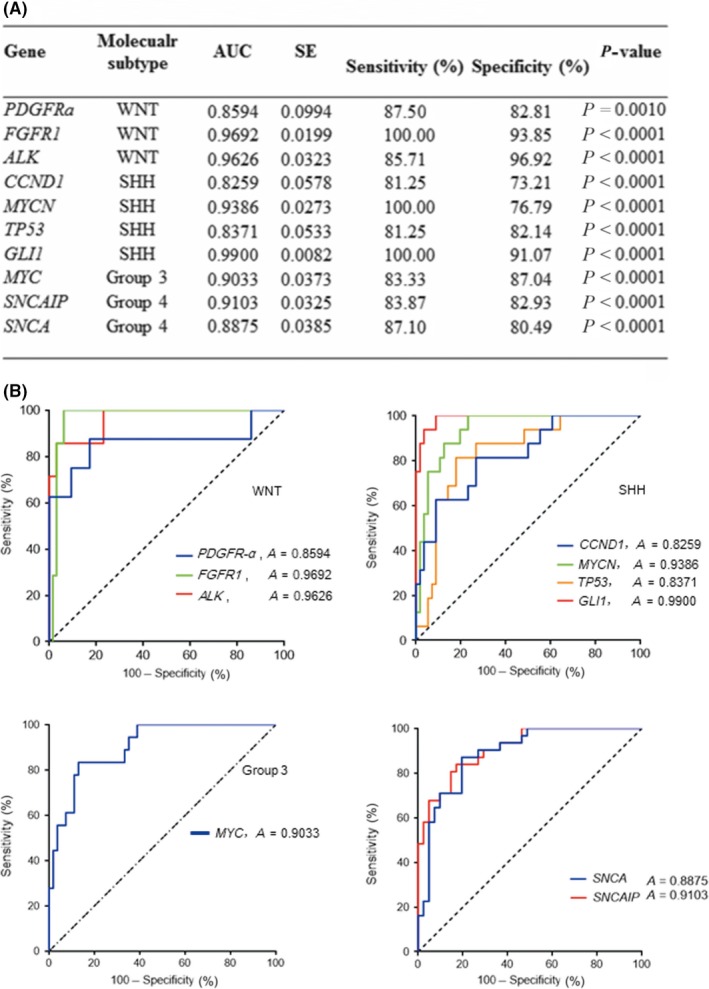
Figure 2.

(A) Receiver operating characteristic (ROC) analysis of 10 signature genes assigned to subgroups of medulloblastoma. AUC, area under the ROC curve. (B) ROC curves were generated to evaluate the accuracy of 10 signature genes as diagnostic markers to discriminate different subgroups of tumors. Based on the RNA expression values from the NanoString analysis, each gene in the corresponding subgroup had a higher expression level compared with the other three groups
