Figure 5.

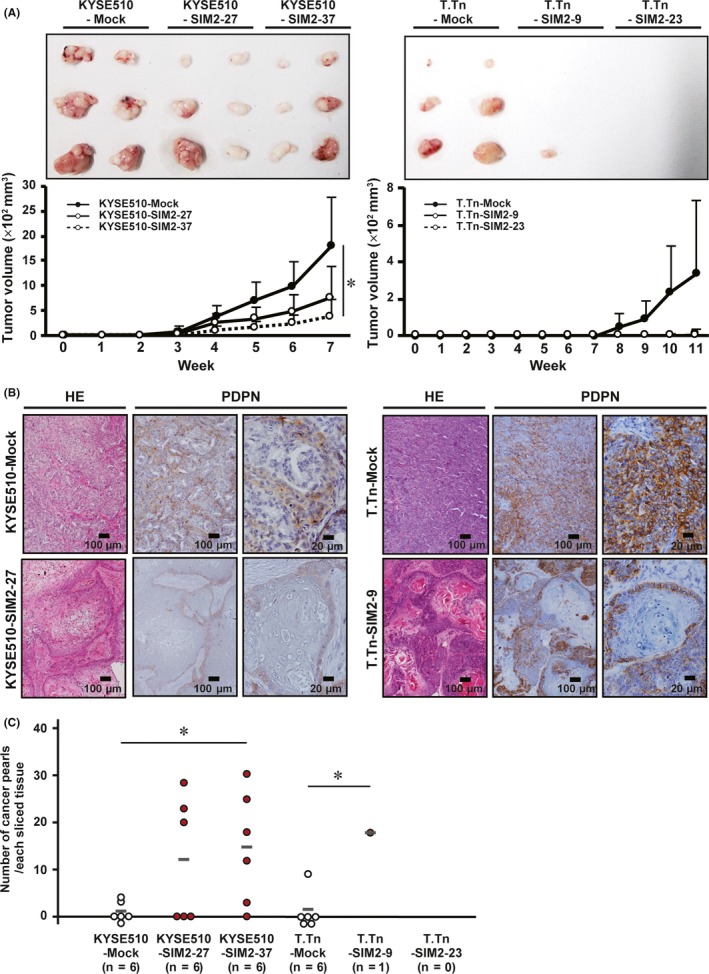
SIM2 induces well‐differentiated histology and in vivo growth suppression of KYSE510 and T.Tn cells. A, Xenograft tumor growth curves of mock‐ and SIM2‐transfectants of KYSE510 and T.Tn in 3 sites of 2 mice (n = 6, mean + SE). B, Hematoxylin and eosin staining and immunocytochemistry for PDPN in xenografts of KYSE510‐Mock, KYSE510‐SIM2‐27, T.Tn‐Mock, and T.Tn‐SIM2‐9. C, Number of cancer pearls per slice in the xenograft of KYSE510‐Mock, KYSE510‐SIM2‐27, KYSE510‐SIM2‐37, T.Tn‐Mock, T.Tn‐SIM2‐23, and T.Tn‐SIM2‐9. Gray bars represent average number of cancer pearls. Each number of cancer pearls between the Mock‐ and SIM2‐transfectants was discriminated by white and red (n = 6, *P < .05)
