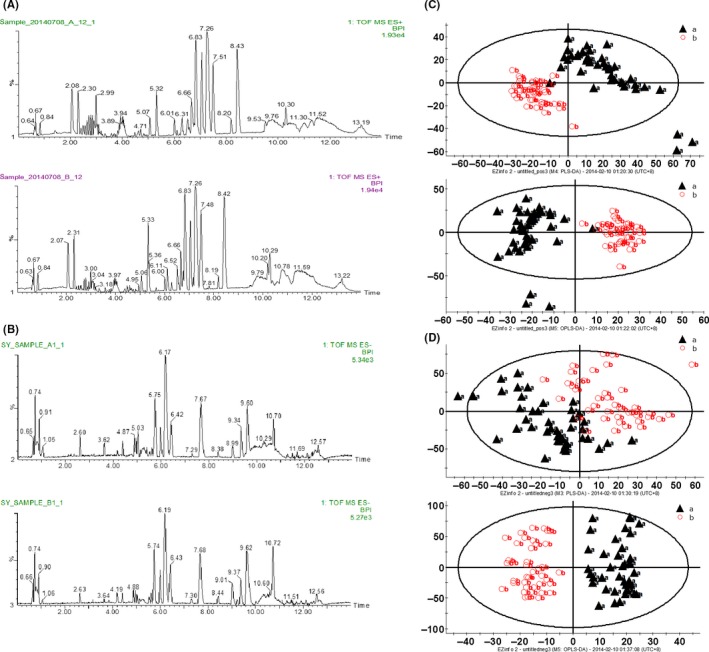
Figure 1.

Serum metabolomics analysis. ultra‐high performance liquid chromatography quadrupole time‐of‐flight mass spectrometry (UPLC‐Q‐TOF/MS) based peak intensity chromatogram of serum in electronic spray ionization (ESI) positive ion mode (A) and negative ion mode (B). In each mode, A, endometrial cancer serum; B, healthy volunteer serum; BPI, based peak intensity chromatogram. Serum metabolic‐profiling analysis of endometrial cancer patients (“a”: black triangles) and healthy volunteers (“b”: red circles) in positive ion mode (C) and negative ion mode (D). Patients, n = 46; healthy volunteers, n = 46
