
Figure 1.
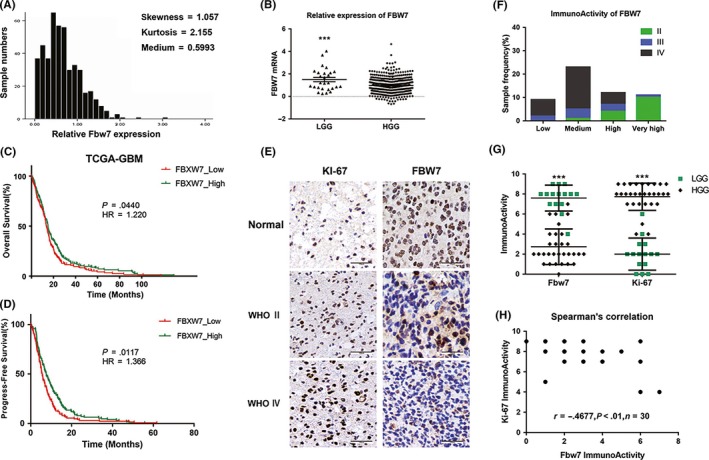
FBW7 subexpression in glioma samples. A, Measures of distribution of FBW7 expression according to data obtained from TCGA. B, Relative expression of FBW7 mRNA in low‐grade glioma (LGG) and high‐grade glioma (HGG) tissues (***P < .001). C,D, Overall and progress‐free survival curve by data of FBW7 expression. Statistical difference existed between the FBW7_high group and the FBW7_low group (*P < .05). E, Representative pictures of FBW7 and Ki‐67 immunohistochemical staining in glioma tissues at different histological grades. Scale bars = 100 μm. F, Sample frequency of FBW7 immunoactivity in glioma tissues of different grades. G, Respective data of FBW7 and Ki‐67 immunoactivity in both LGG group and HGG groups (***P < .001). H, Relevance of FBW7 and Ki‐67 immunoactivity (**P < .01, r = .4677)