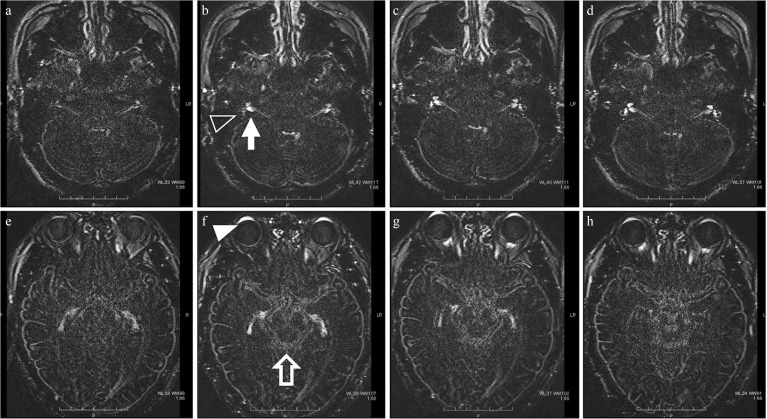
Fig. 3.
Distribution of gadolinium-based contrast medium (GBCM) over time after intravenous injection. Heavily T2-weighted fluid attenuated inversion recovery (FLAIR) imaging over time after GBCM administration to normal volunteers. Images at 30 minutes (a and e), 1.5 h (b and f), 3 h (c and g), and 6 h (d and h) after administration are shown. Signal enhancement was observed in the anterior eye segment (empty arrow head), the perilymph of the inner ear (white arrow head), the cerebrospinal fluid in the internal auditory canal (arrow), Meckel’s cave, and the suprasellar cistern to the ambient cistern (empty arrow), indicating the distribution of GBCM. The peak enhancement after administration was 1.5 h in the anterior eye segment and Meckel’s cave, 3 h in the internal auditory canal and ambient cistern, and 4.5 h (not shown) in the perilymph in the inner ear and optic nerve sheath.

