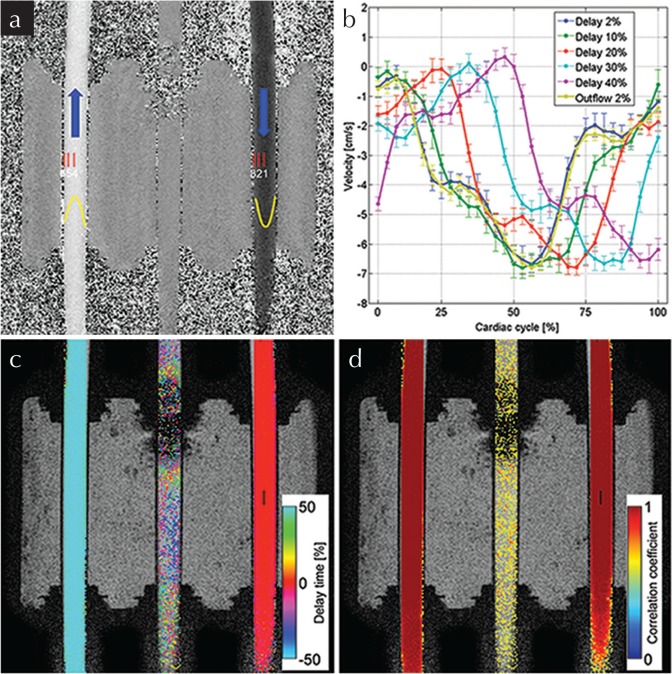
Fig. 3.
Phantom results. The acquired two dimensional-phase contrast (2D-PC) velocity map (a) at the first phase of the cardiac cycle is shown with six ROIs, indicated by red rectangles, while the flow profile approximated by quadratic function is shown in yellow. The velocity waveforms with different delays relative to the cardiac period at ROI1 and the inverted waveform at ROI4 are shown in (b). The error bars represent the range of standard deviation in the ROIs. The delay time map (c) and the maximum correlation map (d) obtained with the reference point set at ROI1 is indicated by a black rectangle. These maps were obtained for a 2% delay. Threshold-based segmentation by a correlation coefficient (<0.5) was applied to maps (c) and (d). The maps (a, c and d) were obtained from data of 2% delay. In (c), no delay appeared in the inflow tube, while a delay of exactly one half (50%) of the cardiac pulse period was in the outflow, proving the physical meaning of the delay time map. In (d), a high correlation coefficient (∼1.0) was distributed uniformly in the tubes with flow, while only noise appeared in the control tube.

