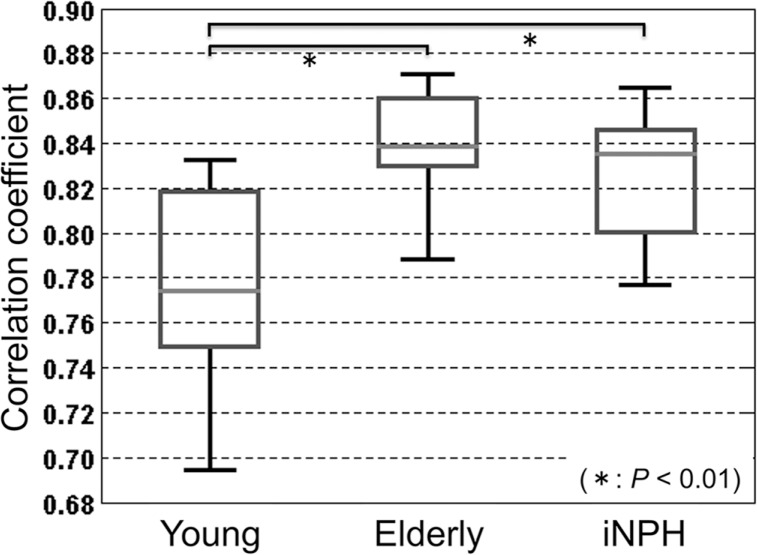
Fig. 8.
Boxplot of the mean correlation coefficient in the intracranial cerebral spinal fluid (CSF) space indicated in Fig. 5 for the three subject groups. Significant differences were observed between the young, healthy group and the others (P < 0.01).

