Figure 1.

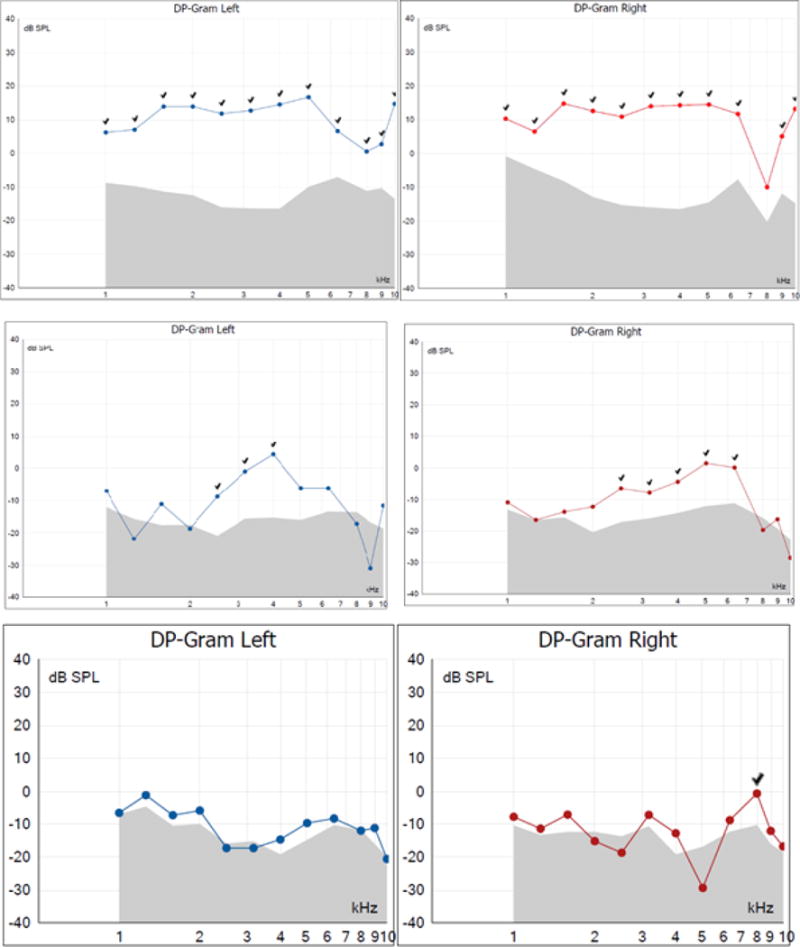
Examples of normal (top) and abnormal (middle and bottom) DPOAE results of the subjects S7, S13, S3. Present DPOAE responses were indicated by check marks in the graphs.

Examples of normal (top) and abnormal (middle and bottom) DPOAE results of the subjects S7, S13, S3. Present DPOAE responses were indicated by check marks in the graphs.