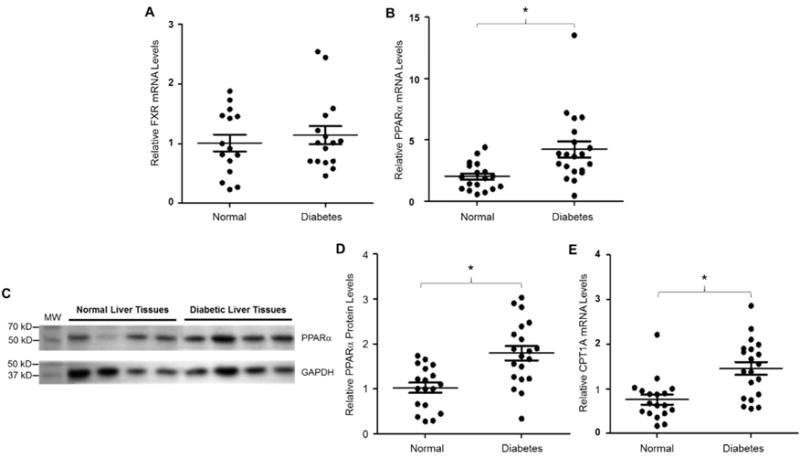
Fig. 12. PPARα signaling was enhanced in diabetes.

(A) hepatic expression levels of FXR and (B) PPARα mRNA were quantified by TaqMan real-time PCR in normal control (n=18) and diabetic subjects (n=20). The expression levels of GAPDH mRNA were used to normalize FXR and PPARα expression. (C) a representative Western blot showing the protein expression of PPARα and GAPDH in diabetic and control subjects. (D) quantification of PPARα protein levels on Western blots normalized by the protein levels of GAPDH. (E) hepatic CPT1A mRNA levels were detected by real-time PCR in control and diabetic subjects. The expression levels of GAPDH mRNA were used to normalize CPT1A expression. The means and standard errors of the group values were indicated by the long and short lines, respectively. * p<0.05 with Student’s t-test.
