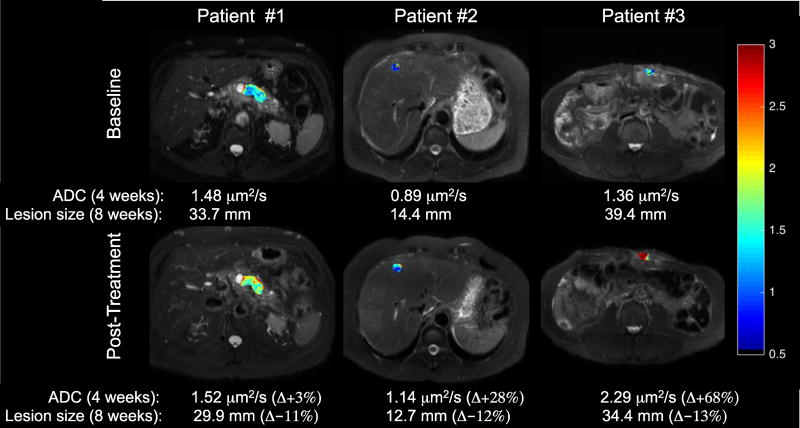
Figure 3. Preliminary DW-MRI results.
ADC maps overlaid onto T2-weighted anatomical images. The baseline and post-treatment mean ADC values and percent change from baseline are presented for each patient. The corresponding baseline and 8-week RECIST measurement, as well as percent change in tumor size is also presented. The expected inverse relationship between changes in ADC and tumor size is observed in all three patients. Notably, a measureable change in ADC for all three patients is detected after one treatment cycle, which corresponds to later changes in tumor size.

