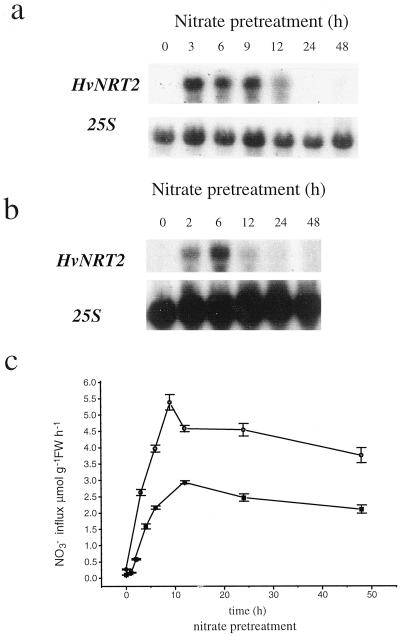
Figure 3.
Time course effects of NO3− pretreatment on root HvNRT2 transcript abundance and 13NO3− influx. a, Northern blot from roots of plants exposed to 1 mm KNO3 for the times shown. b, Northern blot from roots of plants exposed to 10 mm KNO3 for the times shown. Twenty micrograms of total RNA was introduced into each lane and washed at medium stringency. Northern blots were probed with the 25S ribosomal subunit to ensure equal loading of RNA. c, 13NO3− influx values measured at 50 μm NO3− for plants pretreated with 1 (●) or 10 (▪) mm NO3− for the times shown.

