
Figure 6. Intact primary piRNA biogenesis pathway increases MILI‐bound piRNAs derived from pit‐RNAs in the absence of GTSF1.
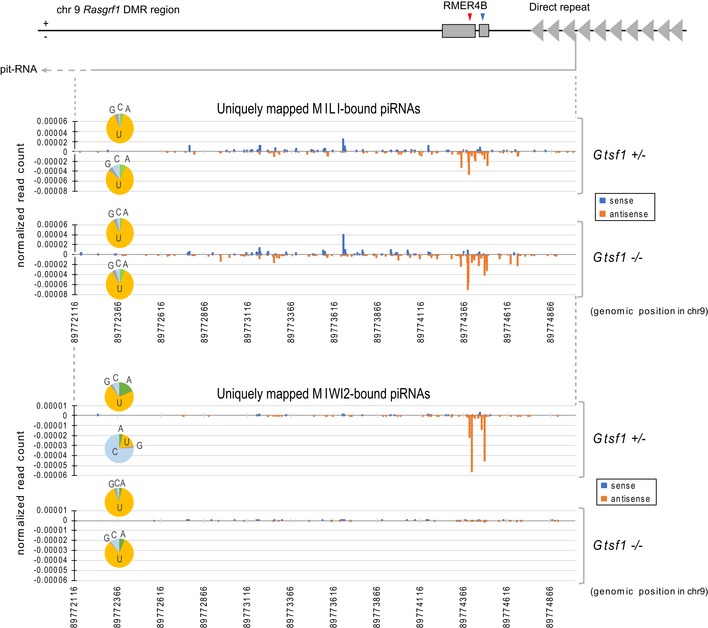
Schematic illustration depicting the genomic locus of pit‐RNA in Rasgrf1 DMR region on chr9 (upper panel). Red or blue arrowhead indicates the slicing position of downstream or upstream side in pit‐RNA, respectively. Uniquely hit MILI (middle panel)‐ and MIWI2 (lower panel)‐bound piRNAs from Gtsf1 +/− and Gtsf1 −/− E17.5 testes were mapped to genomic region transcribing pit‐RNA. The x‐axis shows the position in mm9 chr9: 89772116–89775012. The y‐axis shows the normalized read count relative to 22 nt miRNAs in the deep‐sequencing data from each library. “+” and “−” indicate sense and antisense piRNAs, respectively. The number of mapped piRNAs was counted in the position of their 5′ nucleotide. Pit‐RNA is transcribed in minus strand. Pie charts represent the base composition of the 5′ nucleotide in mapped piRNAs in each strand.