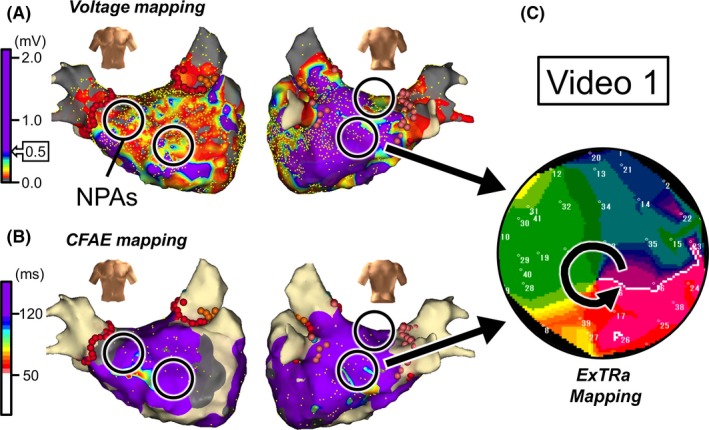
Figure 2.

Case 1: 66‐year‐old female, long‐standing persistent AF (2.2 years). A, Voltage map after cardioversion. B, CFAE map during AF. Black open circles in panels A and B represent nonpassively activated areas (NPAs) detected by the ExTRa Mapping. The %NP values in the 4 NPAs were 82%, 53%, 51%, and 51%. C, An example of a phase map in one of the NPAs. Video S1 demonstrates the relevant phase map movie
