
Figure 2. PINK1 shares binding site on Ubl with Parkin RING1 and endophilin‐A1 SH3.
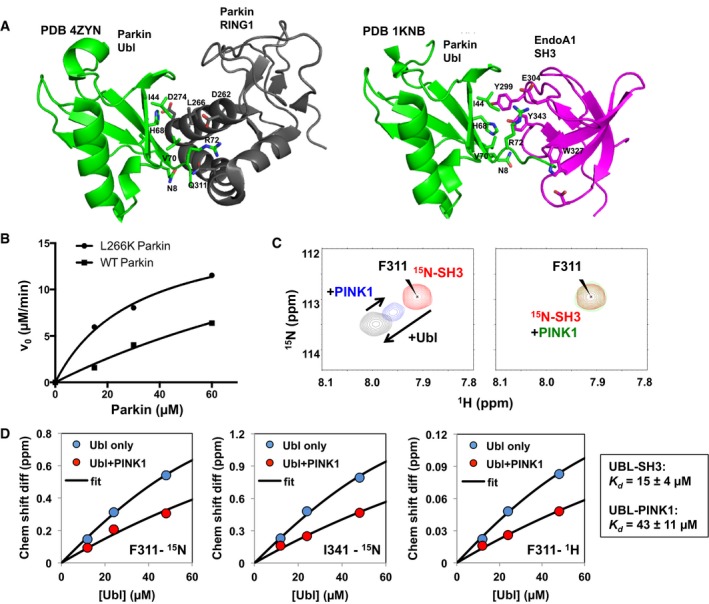
- Binding interface of Parkin Ubl (green) and RING1 domain (black; PDB 4ZYN), and Parkin Ubl (green) and endophilin‐A1 SH3 (magenta; PDB 1KNB).
- Enzyme kinetics of the phosphorylation of full‐length Parkin WT or L266K. 5‐min assays were performed with different concentrations of Parkin WT or L266K with GST‐TcPINK1 (143‐570) and visualized using phos‐tag gels.
- 1H‐15N HSQC NMR spectra of competition assays between 15N‐labeled endophilin‐A1 SH3 domain and GST‐TcPINK1 for Ubl binding. The peaks represent backbone amide signals from the spectra of 62 μM SH3 alone (red), following the addition of 48 μM Ubl (black), 200 μM GST‐TcPINK1 WT (green), or 48 μM Ubl and 200 μM GST‐TcPINK1 WT (blue).
- Chemical shift differences for different 1H‐15N SH3 cross peaks plotted as a function of Ubl concentrations (12, 24, 48 μM), with and without 200 μM GST‐TcPINK1. Data from 10 peaks were fitted to an exact competition model, with the affinity constants displayed in the boxed area (average ± SD).