
Figure EV2. TROSY NMR analysis of TcPINK1 binding to Ubl and Ub.
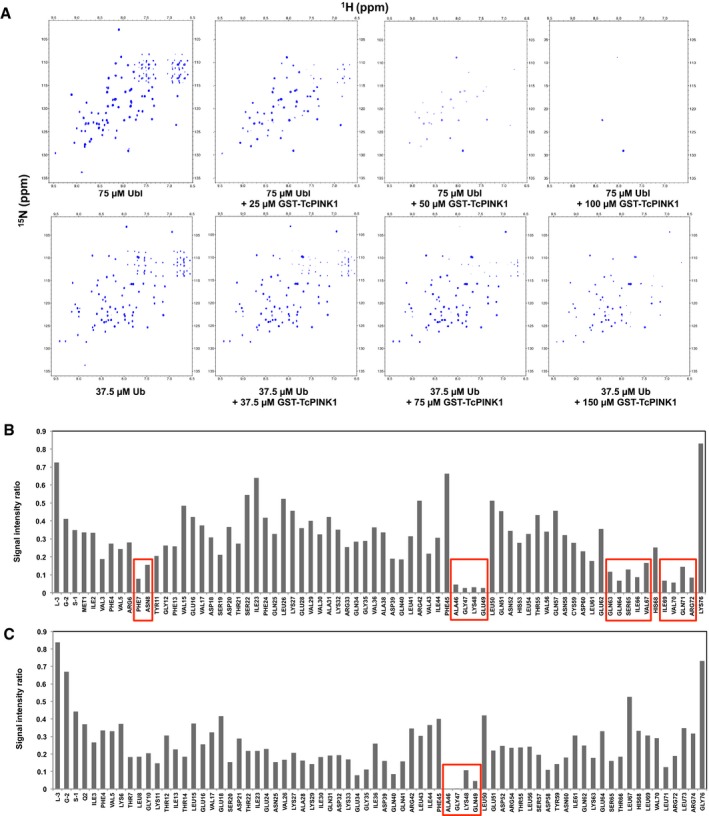
- Full 1H‐15N TROSY NMR spectra of 2H,15N‐labeled Ubl or Ub with different concentrations of GST‐TcPINK1121–570 (corresponding to Fig 1B).
- Bar graph of peak height ratios between the 75 μM Ubl + 25 μM GST TcPINK1121–570 titration point and 75 μM Ubl for all the backbone amides from the H1‐N15 TROSY experiment shown in (A). Amides with the lowest value of peak height ratio are marked by red boxes.
- Bar graph of peak height ratios between the 37.5 μM Ub + 150 μM GST‐TcPINK1121–570 and 37.5 μM Ub for all the backbone amides from the H1‐N15 TROSY experiment shown in (A). Amides with the lowest value of peak height ratio are marked by red boxes.