
Figure 4. Phosphorylation of Ser205 is required for Ubl and Ub binding.
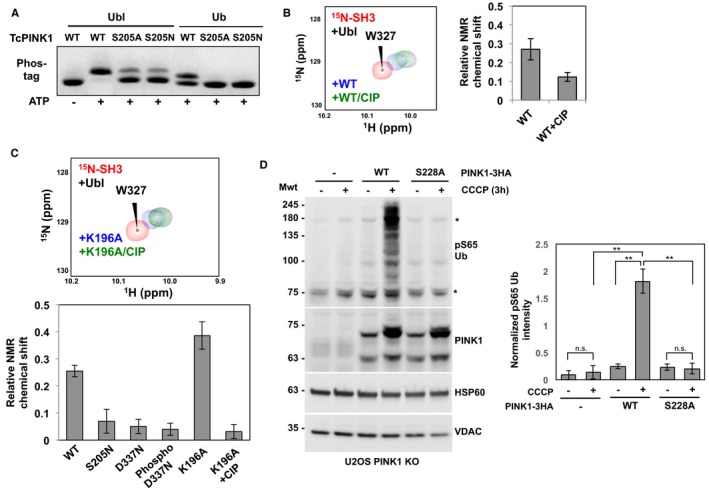
- Phosphorylation of Ub and Ubl by GST‐TcPINK1 WT, S205A, or S205N. The assays were carried out with 30 μM Ubl (for 5 min) or Ub (30 min) with 0.5 μM enzyme and visualized on phos‐tag gels.
- (Left) 1H‐15N HSQC NMR spectra of competition assays between 15N‐labeled endophilin‐A1 SH3 domain and GST‐TcPINK1 for Ubl. The peaks represent the signals from the spectra of 40 μM SH3 alone (red), following the addition of 12 μM Ubl (black), 12 μM Ubl and 100 μM GST‐TcPINK1 WT (blue), or 12 μM Ubl, 100 μM GST‐TcPINK1 WT and CIP (green). (Right) Average weighted chemical shift perturbations of nine different peaks of 15N‐SH3 in response to the addition of GST‐TcPINK1 WT with or without CIP and Ubl. The levels of these changes were calculated relative to the shift upon the addition of only Ubl to 15N‐SH3. The bars represent the mean ± SD of the nine peaks (n = 1).
- NMR competition assay similar to (B), except that 48 μM Ubl was used, with 40 μM 15N‐SH3 and 100 μM GST‐TcPINK1 carrying different mutations or treated with CIP. The bars represent the mean ± SD of the same peaks as in (B) (n = 1). The full spectra are shown in Appendix Fig S6.
- (Left) Immunoblots for phospho‐Ser65 Ub, PINK1, HSP60, and VDAC. U2OS PINK1 knock‐out cells were transfected with WT‐3HA or S228A‐3HA PINK1 and treated with 10 μM CCCP for 3 h. The lysates were analyzed by immunoblotting with the mentioned primary antibodies. (Right) Bar graphs showing the levels of phospho‐S65 Ub quantified from the immunoblots. The amounts were normalized relative to the intensity of HSP60. Bars represent the mean ± SD (n = 3). **P < 0.01; n.s., non‐significant (one‐way ANOVA with Tukey's post hoc HSD test).