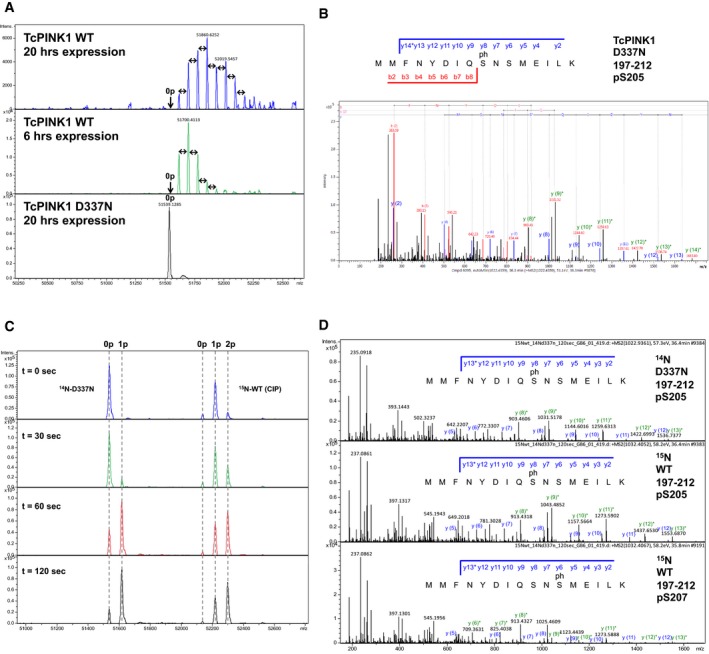
Figure EV4. Mass spectrometry analysis of TcPINK1 autophosphorylation.

- Intact mass spectra of TcPINK1121–570 WT or D337N expressed for different times in E. coli. The double‐edged arrows on the spectra are used to indicate a difference of 80 Da (1 phosphorylation) between peaks. “0p” indicates the theoretical mass of the unphosphorylated protein.
- MS/MS spectrum for the peptide 197‐212 of TcPINK1121–570 D337N, phosphorylated by GST‐TcPINK1121–570 WT (see Fig 3C). The b and y series indicate that phosphorylation takes place at Ser205. The y* series (green) show neutral loss of a phosphate group (H3PO4, −97.7 amu).
- Intact mass spectra of the time course phosphorylation assay of TcPINK1 D337N with CIP‐treated 15N‐TcPINK1 WT (corresponding to the plot in Fig 3D).
- MS/MS spectrum for the peptide 197–212 of TcPINK1121–570 14N‐D337N and 15N‐WT, after 2‐min phosphorylation (see Fig 3E). The b and y series indicate that phosphorylation takes place at Ser205 for the 14N and 15N‐labeled peptides eluting at 36.5 min, and Ser207 for the 15N‐labeled peptide eluting earlier at 35.8 min. The y* series (green) show neutral loss of a phosphate group (H3PO4, −97.7 amu). The different phosphorylation sites give rise to y(6) and y(7) ions with different masses.
