
Figure EV5. HDX analysis of the effect of S205 phosphorylation on K196A.
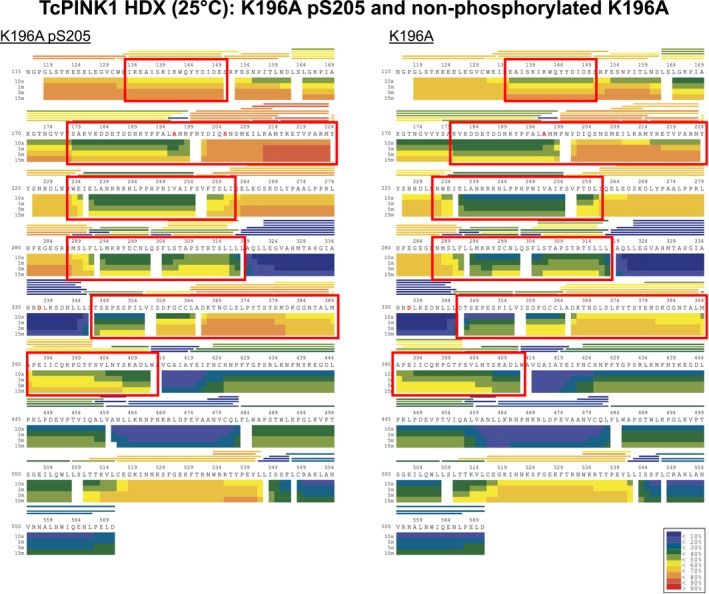
Heat maps of K196A (phosphorylated at Ser205) before and after CIP treatment, representing the level of deuterium uptake over time by different regions of the proteins. Regions of the heat maps enclosed in red boxes show significant differences in deuterium uptake between the two proteins. The small inset on the bottom right contains the color‐coding key for the heat map, with blue and red indicating low and high deuteration rates, respectively.