
Figure 2. The MYO6 interactome can be verified by secondary screens.
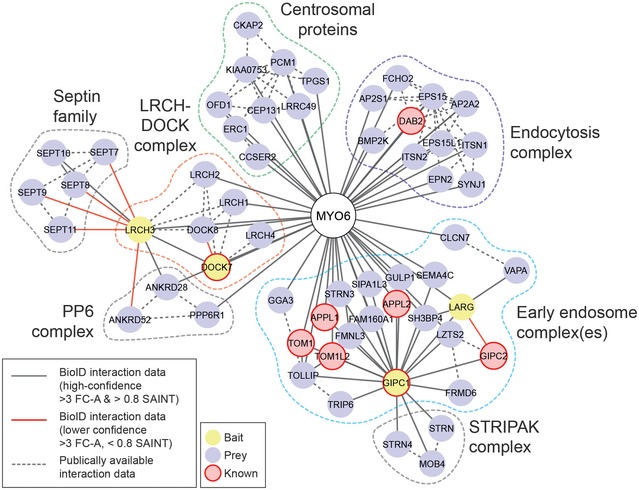
Diagram of the MYO6 protein interaction network identified by BioID (solid lines) with MYO6 (white), GIPC1, LARG, LRCH3 and DOCK7 (yellow) baits and supplemented with interaction data available in public databases (dashed lines). Previously identified MYO6 binding partners are indicated in pink. Lower confidence interactions (> 3 FC‐A, < 0.8 SAINT) are indicated by red lines. All proteins < 2 interactions in the network were excluded for simplicity and further adjustments made manually. Proteins were clustered using a force‐directed layout function in Cytoscape 58. Putative complexes/subcellular locations are highlighted by the dashed boxes.