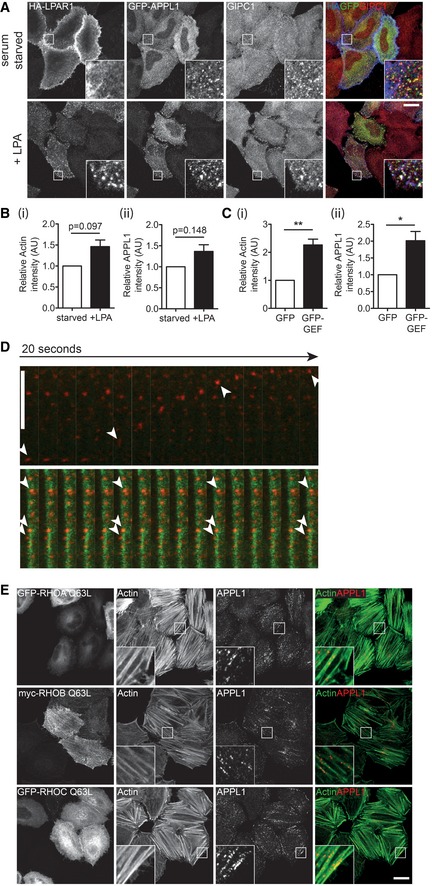
Figure EV3. LPAR1‐LARG‐RHO‐dependent actin reorganisation controls endosome positioning and motility.

- Confocal microscope images of HeLa cells expressing GFP‐APPL1 and HA‐tagged LPAR1 and serum starved overnight. Cell surface LPAR1 was labelled with HA antibody (blue), and uptake was allowed to proceed in the presence of 10 μM LPA for 0 min (upper panels) or 5 min (lower panels). Cells were fixed and immunostained with GFP (green) and GIPC1 (red) antibodies. Scale bar, 20 μm.
- Quantification of (i) phalloidin and (ii) APPL1 signal intensity in cells serum starved or treated with 10 μM LPA for 5 min. Data are the mean of n = 3 independent experiments. Paired t‐test P = 0.0974 (i) and P = 0.1481 (ii). Error bars indicate SEM.
- Quantification of (i) phalloidin and (ii) APPL1 signal intensity in GFP or GFP‐LARG GEF transfected cells. Graph depicts mean from n = 4 independent experiments. Significance was calculated using a one‐sample t‐test. *P < 0.05, **P < 0.01. Error bars indicate SEM.
- Image sequences from spinning disc confocal microscope showing mCherry‐APPL1 (red) and BFP‐LifeAct (green) in mock (top row) or GFP‐LARG GEF (bottom row) transfected HeLa cells. The motility of selected endosomes over time is highlighted by the arrowheads. Scale bar, 10 μm; 0.5 s/frame (see also Movie EV1).
- Confocal microscope images of HeLa cells transfected with GFP‐RHOA Q63L (top row), GFP‐RHOB Q63L (middle row) and GFP‐RHOC Q63L (bottom row). Cells were immunostained with an APPL1 antibody (red) and labelled with phalloidin to visualise actin (green). Scale bar, 20 μm.
