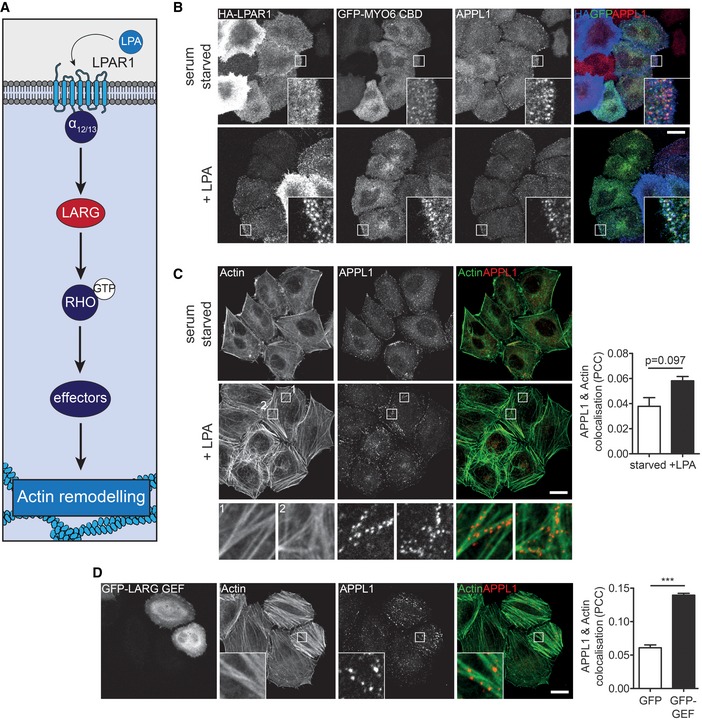
Figure 4. LPAR1‐LARG‐RHO‐dependent actin reorganisation controls endosome positioning.

- Schematic of the LPA‐LARG‐RHO signalling pathway.
- Confocal microscope images of 0 min (upper panels) or 5 min (lower panels) LPAR1 uptake in HeLa cells expressing GFP‐MYO6 CBD and HA‐tagged LPAR1 in the presence of 10 μM LPA. Cells were immunostained for GFP (green), APPL1 (red) and LPAR1 (blue). Scale bar, 20 μm.
- Confocal microscope images of HeLa cells serum starved (upper panels) or treated with 10 μM LPA for 5 mins (lower panels) and immunostained for APPL1 (red) and actin (green). Scale bar, 20 μm. Graph to the right depicts the mean Pearson's correlation coefficient calculated for actin and APPL1 in serum starved or LPA stimulated cells from ≥ 5 fields of view (2–6 cells/field) in n = 3 independent experiments (> 70 cells per condition). Paired t‐test P = 0.097. Error bars indicate SEM.
- Confocal microscopy of HeLa cells expressing GFP‐LARG GEF immunostained for APPL1 (red) and actin (green). Scale bar, 20 μm. Graph to the right depicts the mean Pearson's correlation coefficient calculated for actin and APPL1 in GFP or GFP‐LARG GEF transfected cells from ≥ 7 fields of view (1–7 cells/field) in n = 4 independent experiments (> 100 cells per condition). Significance was calculated using a two‐sample t‐test. ***P < 0.001. Error bars indicate SEM.
