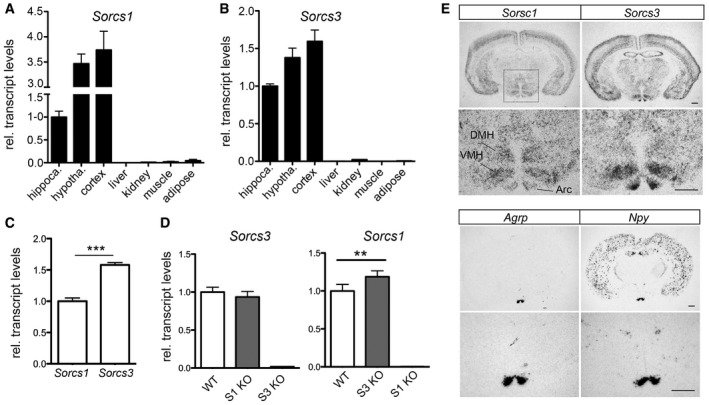
Figure 4. Co‐expression of Sorcs1 and Sorcs3 in the hypothalamus.

-
A, BTranscript levels for Sorcs1 (A) and Sorcs3 (B) in the indicated mouse tissues were assessed by quantitative (q) RT–PCR. Expression levels in the hippocampus were set to 1 (n = 3 mice/group, 10 weeks of age).
-
CComparison of Sorcs1 and Sorcs3 transcript levels using qRT–PCR in hypothalami of WT mice. Identical amplification efficiency for both gene expression assays was validated in a separate experiment (n = 5 mice/group).
-
DTranscript levels for Sorcs1 and Sorcs3 as assessed by qRT–PCR in hypothalami from mice with single Sorcs1 (S1 KO) or Sorcs3 (S3 KO) deficiencies. S3 KO mice show a compensatory increase in Sorcs1 expression compared to WT controls. Expression in WT was set to 1 (n = 5–10 mice/group).
-
EIn situ hybridization (ISH) for Sorcs1 and Sorcs3 on coronal brain sections indicating expression of both receptors in cerebral cortex and in various nuclei of the hypothalamus (Arc: arcuate nucleus; VMH: ventromedial nucleus; DMH: dorsomedial nucleus). ISH for Agrp and Npy on adjacent sections was used as controls for identification of the arcuate nucleus. For each gene, the lower panel represents a higher magnification of the hypothalamus area (marked in the overview micrograph of ISH for Sorcs1). Scale bar: 500 μm; n = 3 mice.
