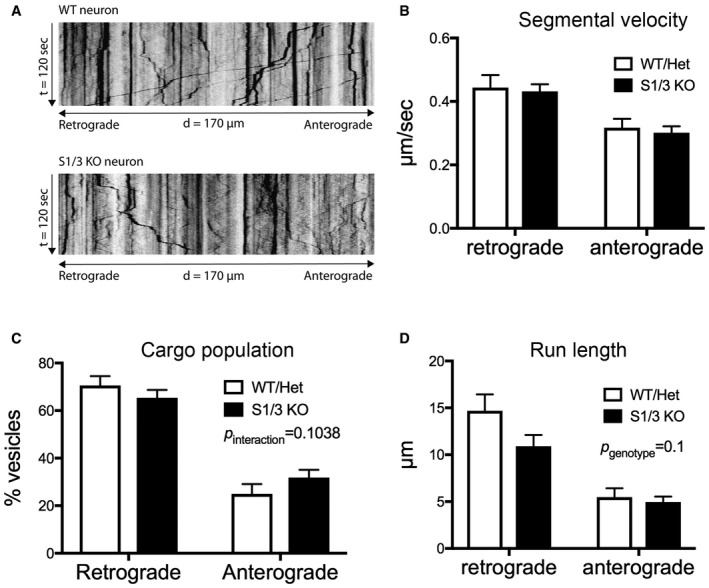
Figure EV4. Time‐lapse imaging of GFP‐TrkB trafficking in primary cortical neurons from WT and S1/3 KO mice.

- Representative kymographs (time–space plots) generated from time‐lapse movies visualizing trafficking of transiently overexpressed GFP‐TrkB in DIV7 primary cortical neurons from WT and S1/3 KO mice.
- Segmental velocity of GFP‐TrkB vesicles uninterruptedly moving in retrograde or anterograde direction in axons from WT and S1/3 KO primary cortical neurons. (n = 15–20 neurons/genotype from two neuronal culture preparations each).
- Population (% of total) of GFP‐TrkB vesicles moving in retrograde and anterograde directions in axons from WT and S1/3 KO primary cortical neurons (n = 28–29 neurons/genotype from three neuronal culture preparations each).
- Total distance covered by GFP‐TrkB vesicles uninterruptedly moving in retrograde or anterograde directions in axons from WT and S1/3 KO primary cortical neurons. (n = 15–20 neurons/genotype from two neuronal culture preparations each).
