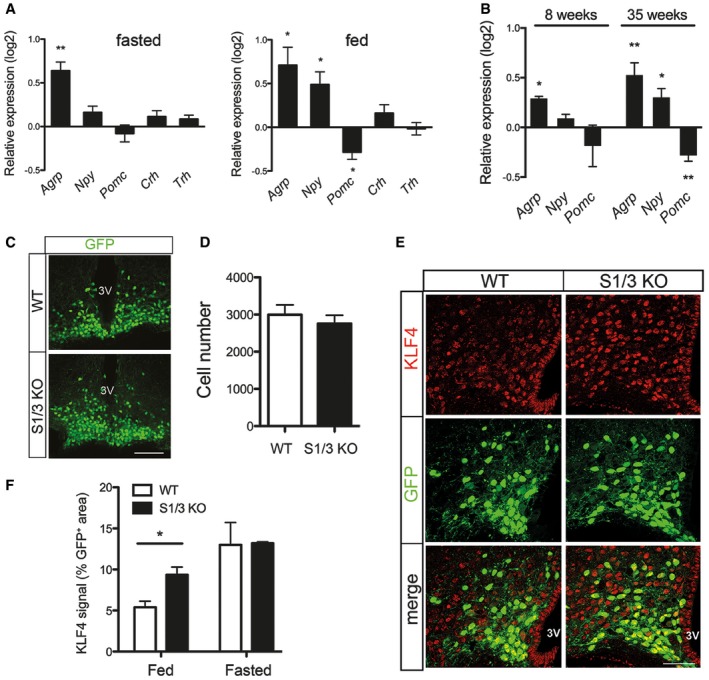
Expression of hypothalamic neuropeptides and hormones as assessed by quantitative (q)RT–PCR in overnight fasted and ad libitum fed mice at 21 weeks of age. Log2‐fold change expression in S1/3 KO relative to the expression in WT is shown. Agrp transcript levels are increased in S1/3 KO under both fasted and fed conditions. n = 8–11 (fasted) or 4–5 (fed) mice/group. Agrp, agouti‐related peptide; Npy, neuropeptide Y; Pomc, proopiomelanocortin; Crh, corticotropin‐releasing hormone; Trh, thyrotropin‐releasing hormone.
Expression of hypothalamic neuropeptides and hormones as assessed by quantitative (q) RT–PCR in overnight fasted mice at 8 or 35 weeks of age. Log2‐fold change expression in S1/3 KO relative to the expression in WT is shown. n = 4–6 (8‐week‐old) or 14–16 (35‐week‐old) mice/group.
Detection of NPY/AgRP neurons by native fluorescence of GFP (green) in the arcuate nucleus of Npy‐hrGFP mice either wild type (Npy‐GFP/WT) or homozygous deficient for SORCS1/3 (Npy‐GFP/S1/3 KO) at 10 weeks of age. Mice were fed ad libitum. Scale bar: 100 μm; 3V, third ventricle.
The total number of NPY/AgRP neurons, as identified by GFP fluorescence, is not affected by loss of SORCS1/3. Six histological sections across the arcuate nucleus per Npy‐GFP/WT or Npy‐GFP/S1/3 KO mouse (as exemplified in panel C) were scored (n = 3 mice/group).
Immunodetection of KLF4 (red) in the arcuate nucleus of Npy‐GFP/WT and Npy‐GFP/S1/3 KO mice. NPY/AgRP neurons were identified by GFP fluorescence (green). Mice were fed ad libitum (n = 6 mice/group). Scale bar: 100 μm; 3V, third ventricle.
Quantification of the KLF4‐positive area in NPY/AgRP neurons on histological sections as exemplified in (E). Two sections per mouse in the middle part of the arcuate nucleus (the region 1.82–1.94 mm caudal to bregma) were analyzed. n = 3 (fasted) or 6 (fed) mice/group.
Data information: Data are shown as mean ± SEM and were analyzed using a two‐tailed unpaired
‐test (A, B, D) or two‐way ANOVA with Bonferroni post‐test (F). *
< 0.01.

