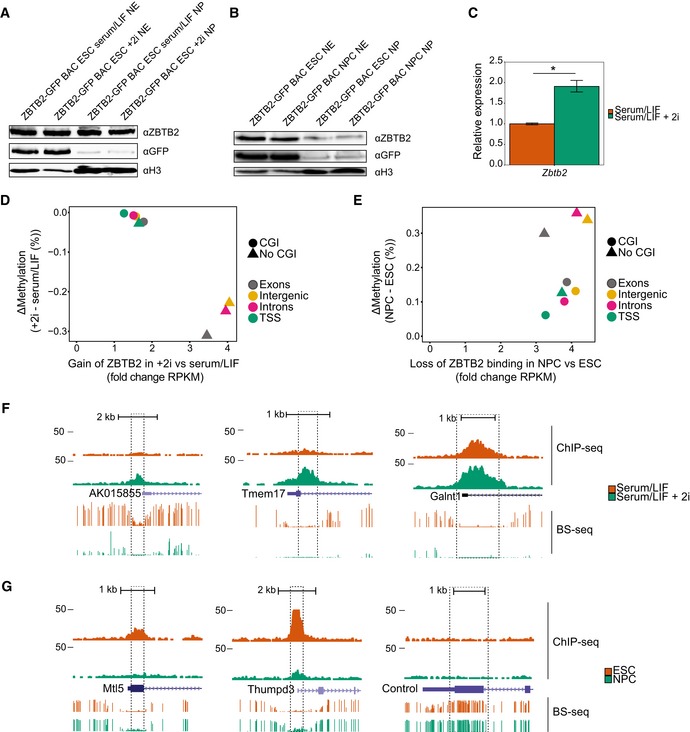
Figure EV2. Comparison of ZBTB2 occupancy and differential DNA methylation (related to Fig 2).

-
A, BWestern blot analyses of endogenous and GFP‐tagged ZBTB2 levels in ZBTB2‐GFP BAC ESCs in serum/LIF or serum/LIF + 2i conditions (A) or ZBTB2‐GFP BAC ESCs or NPCs (B). Histone H3 was used as a loading control. NE = nuclear extract (nuclear soluble fraction), NP = nuclear pellet (chromatin‐bound fraction).
-
CqRT–PCR analysis of Zbtb2 levels in ZBTB2‐GFP BAC ESCs cultured without or with 2i. Data are depicted as mean ± SEM of three biological replicates (*P = 0.02, Welch t‐test).
-
D, EComparison of ZBTB2‐binding dynamics and differential DNA methylation 20, 21 at the union of ZBTB2 peaks that were called in our three ChIP‐seq experiments, presented as the average values for each genomic category. ZBTB2‐binding dynamics (plotted on the x‐axis) are calculated as the fold change in RPKM values obtained from ZBTB2‐GFP ChIP‐seq in +2i versus serum/LIF conditions (D), or in NPCs versus ESCs (E). Differential DNA methylation (plotted on the y‐axis) is the difference in average methylation status between +2i and serum/LIF (D) or NPCs and ESCs (E).
-
F, GUCSC genome browser views of genomic regions that were used for locus‐specific analysis of ZBTB2 binding and DNA methylation (Fig 2B and C). All loci except the negative control locus contain a CGI. qPCR primers (Appendix Table S5) were designed to amplify a 100‐ to 200‐bp region within the dashed lines. BS‐seq = bisulphite sequencing 21, 45.
Source data are available online for this figure.
