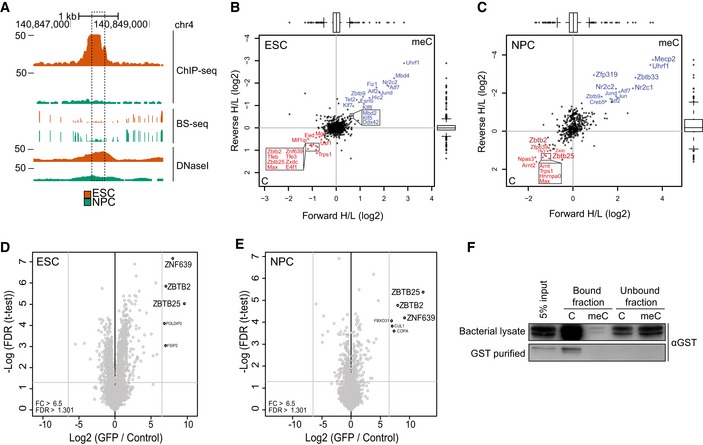
Figure 3. ZBTB2 reads unmethylated DNA directly and independently of its interaction partners.

- A
-
B, CScatterplots of DNA pull‐downs with the genomic region indicated in (A), using nuclear protein extract from wild‐type ESCs (B) or NPCs (C). Proteins binding specifically to the unmethylated or methylated sequence are depicted in the lower left or upper right quadrant, respectively. Significant outliers were determined through box plot statistics. In (C), ZBTB2 and ZNF639 were just below the statistical cut‐offs and have been indicated in dark red. All pull‐downs were performed in duplicate and included a label‐swap. Box: median (central line), first and third quartile (box limits); whiskers: 1.5 × interquartile range.
-
D, EVolcano plots of label‐free GFP pull‐downs using nuclear extracts from ZBTB2‐GFP BAC ESCs (D) or NPCs (E). Label‐free quantification (LFQ) intensity of the experiment relative to the control [fold change (FC)] is plotted on the x‐axis; FDR‐corrected t‐test values are plotted on the y‐axis. Grey lines indicate statistical cut‐offs. All pull‐downs were performed in triplicate.
-
FWestern blot analysis of DNA pull‐downs using generic unmethylated or methylated DNA probes with unpurified (upper panel) or GST‐purified (lower panel) recombinant GST‐ZBTB2. Bound fraction consists of proteins that bound to the DNA probes, and unbound fraction is 5% of the remaining supernatant.
Source data are available online for this figure.
