
Figure EV3. PAWS1 regulates the CK1α protein but not mRNA levels in cells.
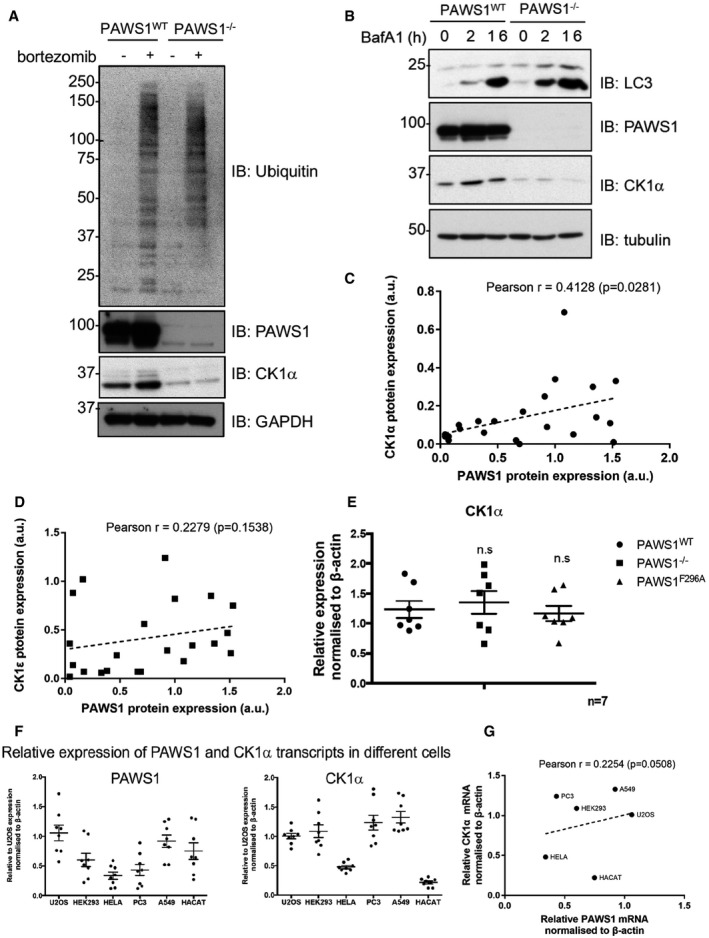
- PAWS1WT and PAWS1−/− U2OS cells were treated with 10 μM of the proteasome inhibitor Bortezomib for 6 h and extracts were analysed by Western blotting with the indicated antibodies.
- PAWS1WT and PAWS1−/− U2OS cells were treated with 50 μM Bafilomycin A1 (BafA1) for 2 or 16 h, and extracts were analysed by Western blotting with the indicated antibodies.
- Correlation plots of PAWS1 and CK1α protein expression from Fig 6E based on densitometry (using ImageJ) quantification of immunoblots normalised to GAPDH levels (a.u.: arbitrary units). Each dot represents a cell line. Pearson r coefficient and one‐tailed P‐values were calculated with Prism6 software.
- As in (C), except that PAWS1 and CK1ε protein levels were quantified and plotted.
- CK1α mRNA in PAWS1−/− cells rescued with PAWS1WT or GFP control analysed by quantitative RT–PCR. Data are represented as fold induction over controls and normalised internally to β‐actin control. Error bars represent ± SEM (n.s.: no statistical significance; n = 3).
- Relative expression of PAWS1 and CK1α transcripts in the indicated cancer cell lines was measured by RT–PCR (n = 7; error bars represent ± SEM).
- Correlation plot of relative PAWS1 and CK1α mRNA expression (normalised to β‐actin) in a subset of the indicated cancer cell lines. Pearson r coefficient and one‐tailed P‐values were calculated with Prism6 software.
Source data are available online for this figure.