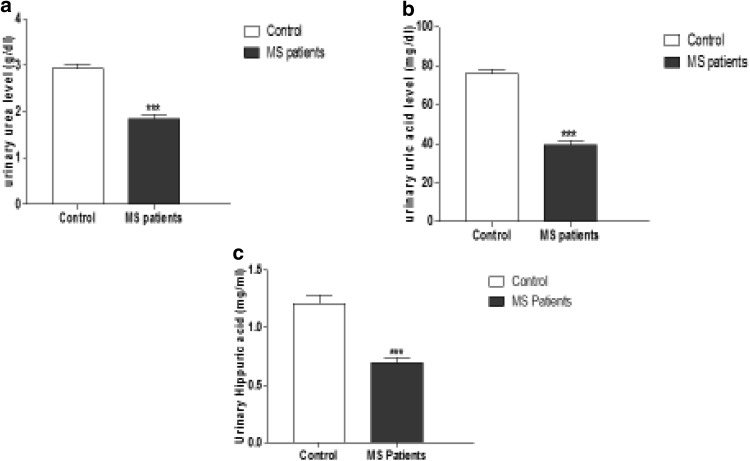
Fig. 1.
The mean urinary value of urea, uric and hippuric acid in MSpatients and control groups. a Urinary area level (g/dl), b urinary uric acid level (mg/dl) and c urinary hippuric acid level (mg/ml) of control and MS patients, expressed as mean ± SEM. *** P < 0.0001 using unpaired t-student test followed by Welch’s correction

