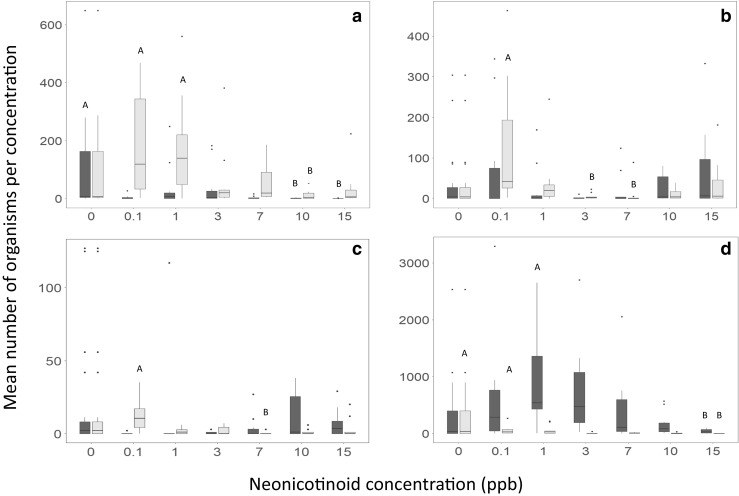
Fig. 1.

Effect of thiamethoxam (light grey) and clothianidin (dark grey) on mean population of aquatic invertebrates, for each separate neonicotinoid, means labelled A are significantly different than those labelled B; Dunn’s with Bonferroni correction. A-Chironomidae: thiamethoxam (X2 (6) = 16.1, p = 0.013)); 0.1 ppb − 10 adj. p = 0.036, 1–10 ppb adj. p = 0.048; clothianidin (X2 (6) = 21.9, p = 0.001)); control—10 ppb adj. p= 0.048, control—15 ppb adj. p = 0.003). B-Culex larvae: thiamethoxam (X2 (6) = 20.8, p = 0.002)); 0.1–3 ppb adj. p = 0.031, 0.1–7 ppb adj. p = 0.001; clothianidin—no statistically significant relationship existed between concentration and population abundance despite numbers dipping at 3 and 7 ppb (p = 0.498). C—Culex pupae: thiamethoxam (X2 (6) = 14.8, p = 0.021)); 0.1–7 ppb adj. p = 0.021; clothianidin (X2 (6) = 14.5, p = 0.025)); despite a statistically significant relationship overall, post hoc results showed no overall difference between means of each concentration replicate group when examining adjusted significance. D—Ostracoda: thiamethoxam (X2 (6) = 20.46, p = 0.002)); control—15 ppb adj. p = 0.033, 0.1–15 ppb adj. p = 0.029; clothianidin (X2 (6) = 17.6, p = 0.007)); 1–15 ppb adj. p = 0.023
