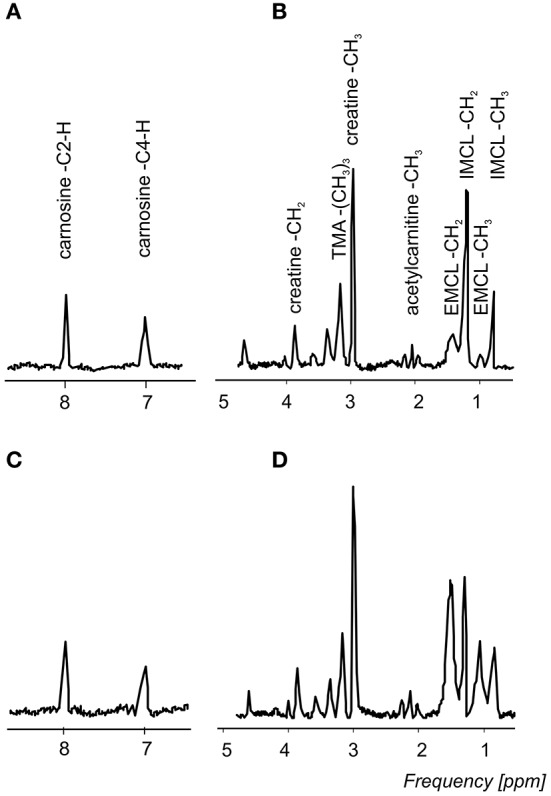
Figure 2.

A representative 1H-MRS spectrum from a triathlete (A,B) and a healthy active volunteer (C,D) acquired from the vastus lateralis muscle. (A,C) present carnosine spectral lines at 7 and 8 ppm and (B,D) show the trimethyl ammonium (TMA) groups of carnitine, acetylcarnitine, and choline at 3.20 ppm, creatines at 3.03, and 3.9 ppm, acetylcarnitine at 2.13 ppm, and extramyocellular (EMCL) and intramyocellular (IMCL) lipid resonance lines at 1.5 and 1.3 ppm (CH2 group). For better visualization, a 1.5-Hz Lorentzian apodization filter was applied to reduce noise in the spectra. All spectra were normalized with respect to the water signal.
