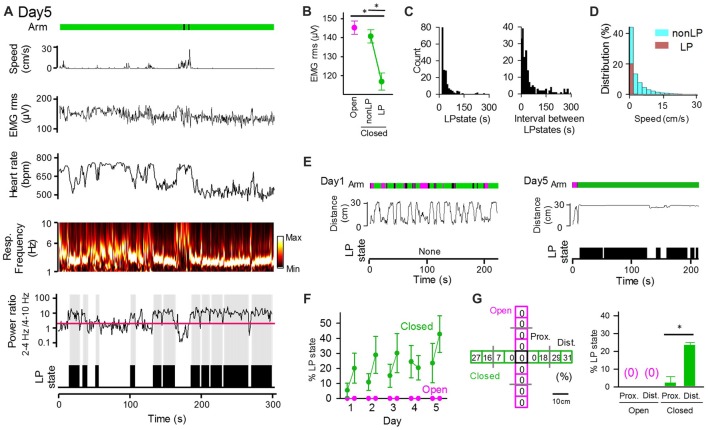
Figure 3.
The low peripheral (LP) states of peripheral activity in closed arms vary across sessions and days. (A) The same representative data as that shown in Figure 2A. The ratio of 2–4 Hz power to 4–10 Hz power of respiratory signals is shown under the power spectrum, with the red horizontal line indicating a ratio of 2. LP states are represented by black areas below the traces. (B) RMS of EMG signals in LP states and non-LP states. *P < 0.001, paired t-test. (C) (Left) Distribution of the duration of single LP states. (Right) Distribution of the intervals of LP states. (D) Distribution of animal’s moving speed depicted separately in LP (brown) and non-LP states (cyan). (E) (From top to bottom) Arms wherein the animal was located at the same position as that in (A), distance between the animal’s locations and the center of the maze, and periods of the LP states shown in (A). (F) Average probability of LP states plotted for open and closed arms in individual sessions. The statistical results in these figures are described in the main text. (G) (Left) Each arm of the maze was divided into four regions, and the ratio of the duration of LP states to the total duration the animals spent in each region was calculated. (Right) Average probability of LP states plotted for regions wherein the animals were located. Proximal and distal regions were defined as regions with distances from the center of the maze less than and greater than 15 cm (the half length of an arms distance), respectively. *P < 0.001, paired t-test.

