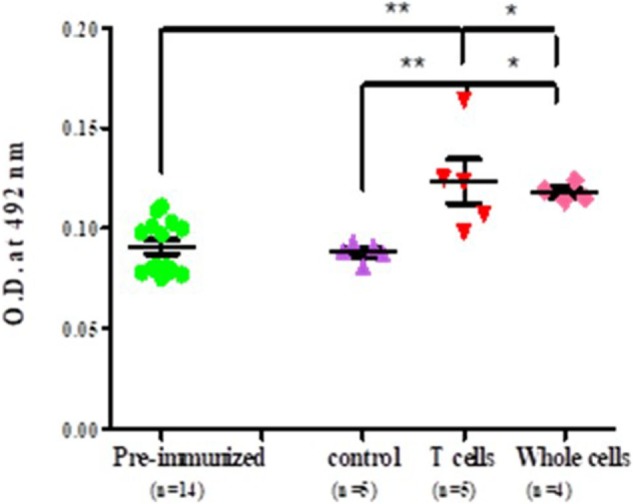
Figure 5.

Level of antibodies against myosin proteins in adoptively transferred naïve female BALB/c mice. Each dot represents the individual OD. Horizontal line with error bars represent mean OD value with SEM. Control group adoptively transferred with whole cells and experimental group adoptively transferred with T cells and whole cells.
