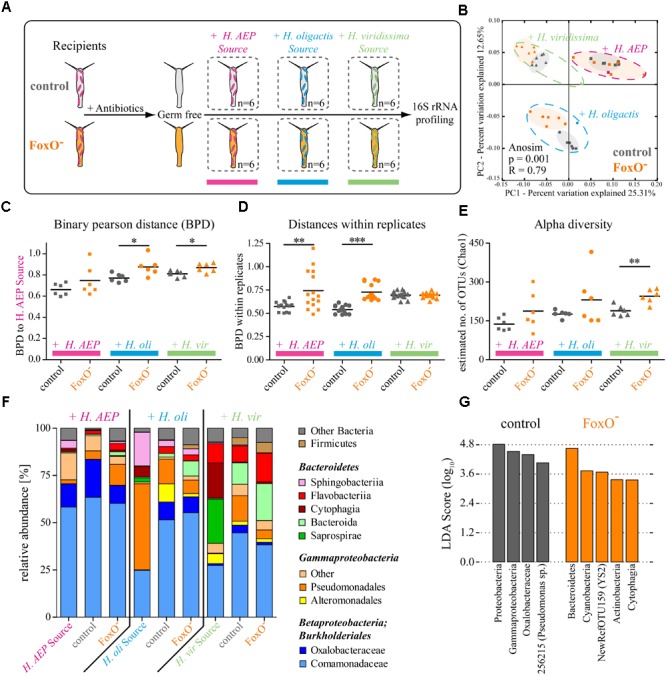
FIGURE 2.

FoxO controls metaorganism homeostasis and microbiome resilience. (A) Schematic representation of the experimental design. Germ-free polyps of control and FoxO- (H. vulgaris (AEP)) were recolonized with bacterial sources either from the same species (H. AEP) or species-specific bacteria from H. oligactis or H. viridissima for 4 days. (B) Analysis of bacterial communities associated with control or FoxO- polyps after recolonization with different bacterial sources using principal coordinate analysis (PCoA) of the binary Pearson distance (BPD) matrix. Note the distinct clusters for the different bacterial backgrounds as well as the differences in recolonization outcome for control and FoxO- animals. Ellipses were added manually. Dashed ellipses group samples for source communities and ANOSIM analysis. The percent variation explained by the PCoA is indicated on the axes. (C) BPDs of control and FoxO- polyps recolonized with different bacterial source communities to the H. vulgaris (AEP) source community. (D) Within treatment BPDs of control and FoxO- animals representing the diversity variability between the biological replicates. (E) Choa1 estimated alpha diversities for control and FoxO- after recolonization. (F) Bar charts representing the microbiota of source communities and recipient polyps with mean relative abundances of bacterial classes. (G) Linear discriminant analysis of effect sizes (LEfSe) results for recolonization of control and FoxO- polyps over all bacterial backgrounds, indicating bacterial groups specific for one of the conditions. ∗p ≤ 0.05, ∗∗p ≤ 0.01, ∗∗∗p ≤ 0.001.
