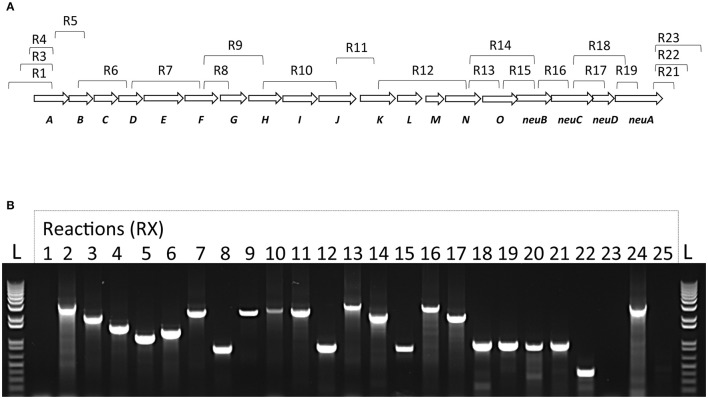
Figure 3.
Transcriptional analysis of the S. suis cps operon. (A) Schematic representation of S. suis capsular polysaccharide synthesis coding region with corresponding RT-PCR reactions and (B) agarose gel electrophoresis of RT-PCR reaction products visualized under UV light. Total bacterial RNA was isolated and converted to cDNA. RNA samples without reverse-transcription step were used as template to verify absence of genomic DNA in lane R25. Genomic DNA with the same primers was used as positive control (lane R24). All RT-PCR products migrated accordingly to their expected sizes. DNA size standards (“L”) are depicted at the left- and right-end sides.

