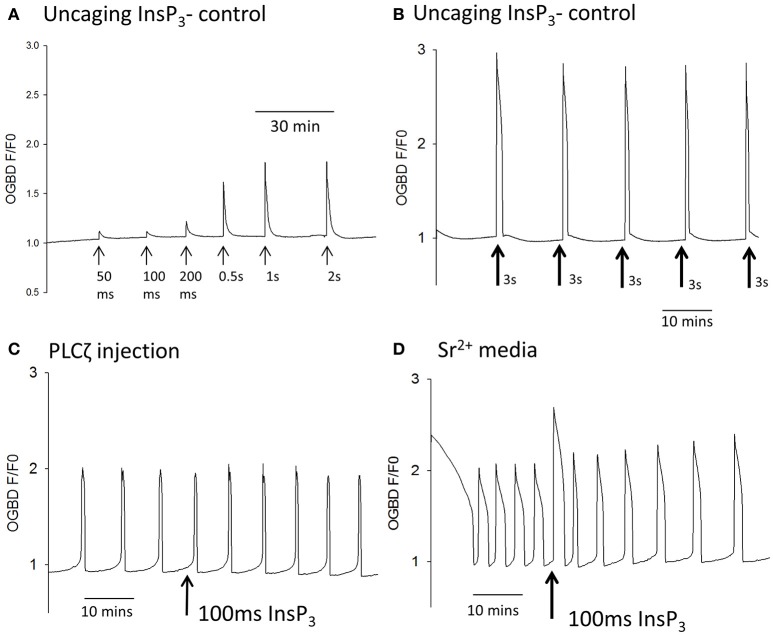
Figure 1.
Ca2+ oscillations and uncaging pulses of InsP3. In (A) an example trace is shown of Ca2+ increases (as measured by OGBD fluorescence) in an egg in response to different amounts of InsP3. Eggs were injected with caged InsP3 and exposed to varying durations of UV light pulse (from 50 ms to 2 s) to photo-release the InsP3 (trace typical of n = 21 eggs). In this and all other traces shown, the pulses were applied at points indicated by the arrows. In (B) an example trace is shown of changes in cytosolic Ca2+ in an egg in response to the “uncaging” of caged InsP3 using long duration UV pulses of 3 s. Arrows indicate where pulses of UV light were applied (typical of n = 7 eggs). In (C) an example trace is shown of changes in cytosolic Ca2+ in an egg stimulated following the microinjection of mouse derived PLCζ cRNA (0.02 μg/μl) and caged InsP3. The arrow indicates where a 100 ms pulse of UV light was applied (n = 14 eggs). In all 14/14 such recordings there was no sudden increase in Ca2+ even when the pulse was applied during the pacemaker rising phase of Ca2+. In (D) an example trace is shown with changes in cytosolic Ca2+ in an egg stimulated by media containing 10 mM Sr2+. The arrow indicates where a 100 ms pulse of UV light was applied to uncage InsP3 (n = 32 eggs). In all 32/32 cases there was a rapid Ca2+ increase that started with the very next OGBD fluorescence measurement after the UV pulse (<10 s).

