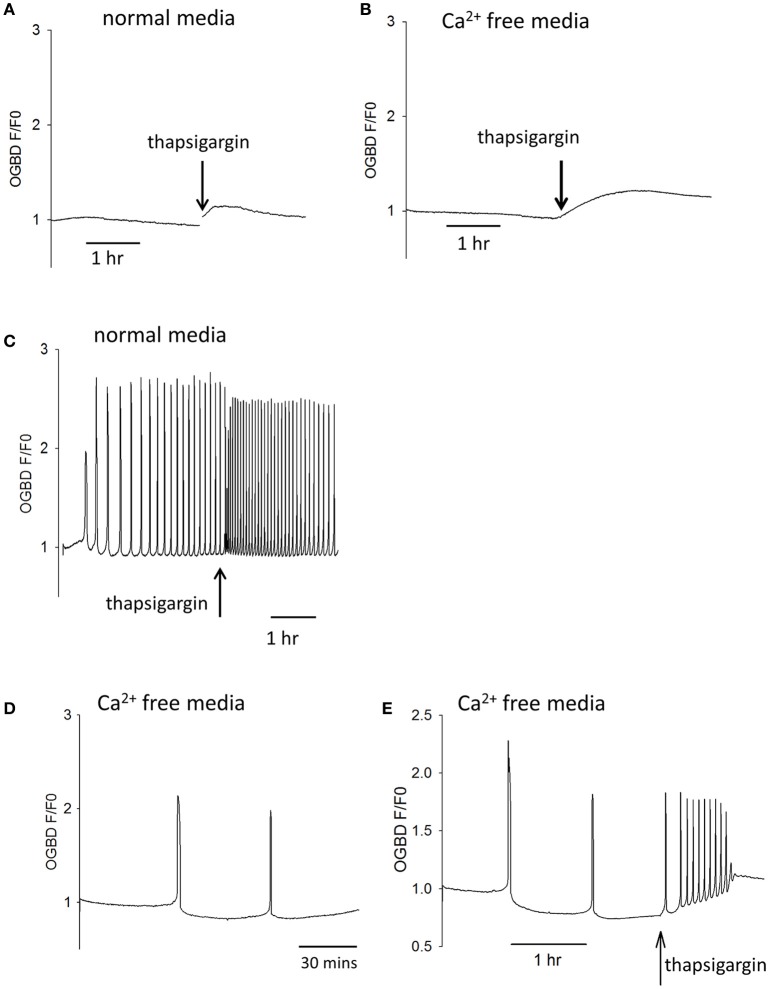
Figure 3.
Cytosolic Ca2+ and the frequency of Ca2+ oscillations. In (A) an example is shown of a trace showing changes in cytosolic Ca2+ in an egg incubated in normal HKSOM media following the addition of 500 nM thapsigargin (typical of n = 12 eggs). The increase in Ca2+ was from 0.936 ± 0.013 SEM to 1.07 ± 0.0197 SEM which is a significant (P < 0.01). In (B) a similar example is shown of the addition 500 nM thapsigargin to an egg in Ca2+ free media (containing 100 μM EGTA), which was typical of n = 12 eggs. The increase in basal Ca2+ was from 0.908 ± 0.0134 SEM up to 1.29 ± 0.0168 SEM which was significant (P < 0.001). In (C) an example of one of 6 eggs is shown where the same low concentration of thapsigargin increased the frequency of Ca2+ oscillations by 1.72-fold (±0.07 SEM). In (D) a trace is shown from an egg that was injected with PLCζ RNA and then placed in Ca2+ free media. The mean number of Ca2+ spikes in such experiments was 1.56 (n = 18 eggs, ±0.31 SEM) Ca2+ spikes in 10,000 s (2 h 47 min) h. The Ca2+ levels decreased to 0.84 ± 0.029 SEM which was significantly less than the starting level (P < 0.001). In (E) is shown an example of an egg that had been injected with PLCζ RNA and then placed in Ca2+ free media as in (C). However, in these experiments 500 nM thapsigarin was added after >2 h. In 16/17 such treated eggs there was an increase in the frequency of Ca2+ oscillations. There were an average of 1.77 spikes (±0.18 SEM) before adding thapsigarin but a mean of 7.11 spikes (±1.3 SEM) after thapsigarin addition. The resting Ca2+ level increased from 0.84 ± 0.029 SEM, before adding thapsigargin to 1.076 ± 0.017 sem in eggs where it stabilized. This is a signicant increase in Ca2+ concentration (P < 0.001).

