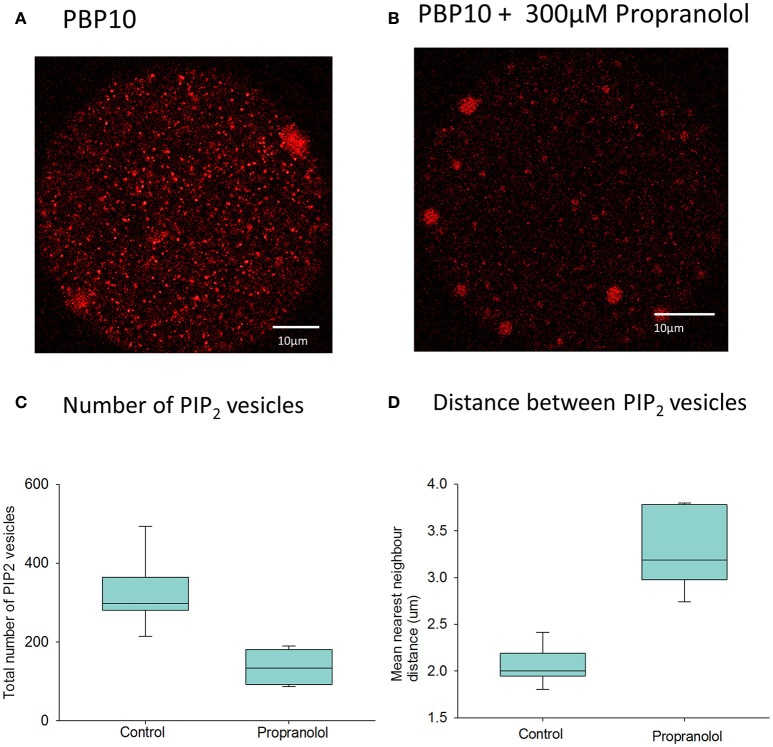
Figure 5.
PIP2 distribution in mouse eggs using PBP10. In (A) an example is shown of the distribution of fluorescence of PBP10 in a mouse egg 1.5 h after injection of PBP10 (n = 21). Scale bars are 10 μm. (A) nearest neighbor analysis indicated that the mean vesicle distance for all 21 control eggs is 2.2 μm. In (B) an example is shown of an egg injected with PBP10 where and incubated in media with 300 μM propranolol (n = 13). In (C) particle analysis (n = 14 eggs) indicates that the mean vesicle diameter is 0.89 μm and the mean number of vesicles present per egg is 298.9. (C) Shows a plot of the total number of PIP2 positive vesicles present in eggs following injection of PBP10 using particle analysis. Results are shown for both eggs incubated in standard M2 media (control) (mean number of vesicles = 324, n = 7) and those incubated in M2 containing 300 μM propranolol during imaging (mean number of vesicles = 131, n = 7). There is a significant reduction in the number of PBP10 vesicles following propranolol treatment compared to control media (p = < 0.001, Student's T-test). (D) shows a plot of the mean nearest neighbor distances of PIP2 positive vesicles present in eggs. The results are shown for parallel groups of eggs incubated in standard M2 media (control) (mean distance = 2.0 μm, n = 7) and for those incubated in M2 containing 300 μM propranolol during imaging, (mean distance = 3.3 μm, n = 7). A Mann–Whitney U-test showed a significant increase in the distance between the PBP10 vesicles following propranolol treatment compared to control media (p = < 0.001).

