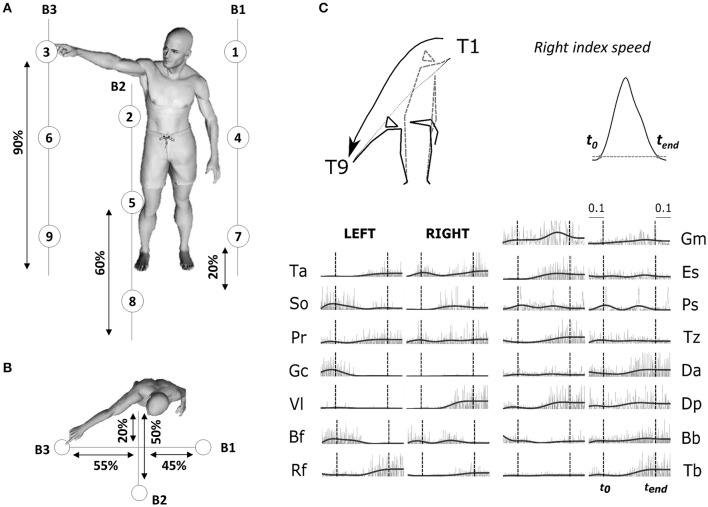
Figure 1.
(A) Illustration of the experimental protocol. Placement of the 9 targets and the position of the three bars supporting the targets are based on the subject's height (shown as percentages in figure). Subjects performed point-to-point movements between all pairs of targets (a total of 72 tasks) and repeated each movement 30 times for each direction. (B) Top-view of the task. (C) Typical raw electromyographic data, for subject S2 and condition T1–T9 (illustrated by the kinematic of initial and final postures and finger trajectories recorded for the associated typical trial). The recorded activity of 30 muscles, normalized in amplitude (divided by the maximum across the whole experiment for each muscle), are plotted from time t0-0.1sec to time tend+0.1 s. Raw activations are shown in gray and filtered signals, used as input to the module extraction algorithm, are shown in black. Movement onset t0 and offset tend (chosen as the initial and final time-point of a time period in which the fingertip velocity was continuously above 5% of its maximum) are shown in the figure as dotted vertical lines for each muscle.

