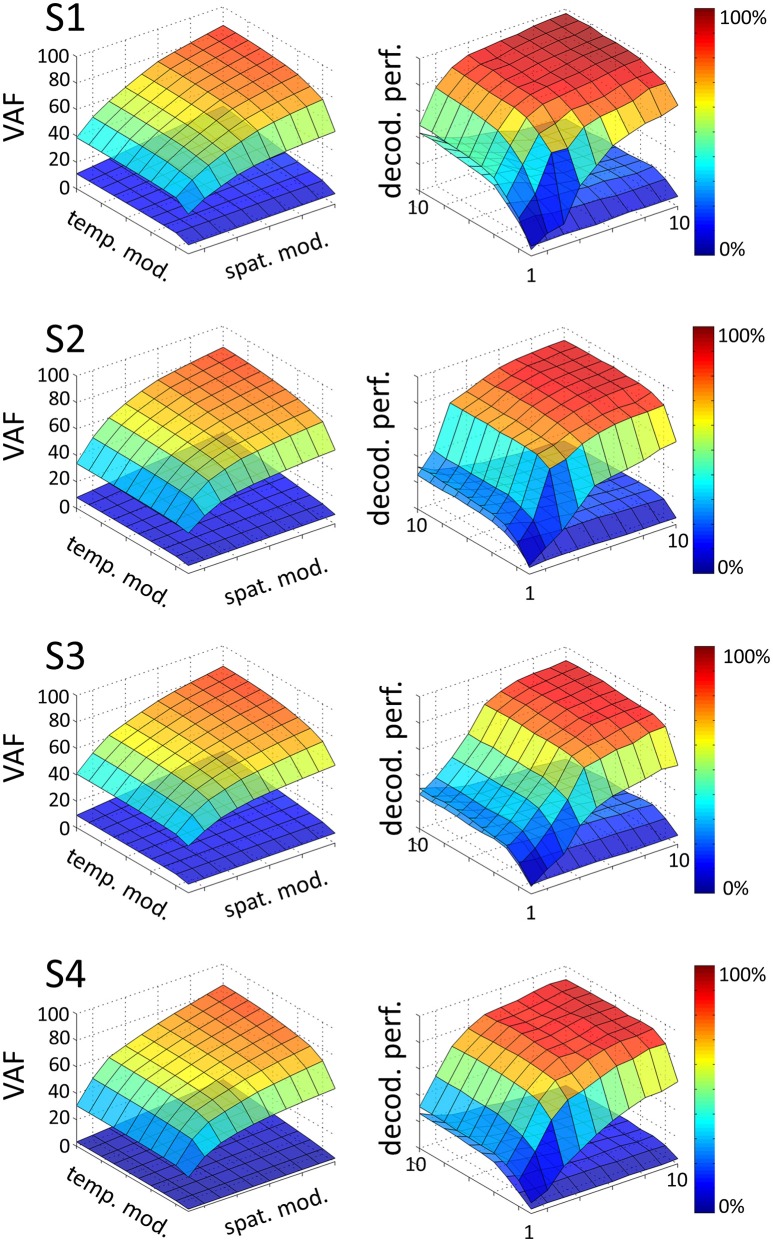
Figure 2.
Influence of the number of temporal (P = 1…10) and spatial modules (N = 1…10) on VAF (left) and decoding performance (right), for each subject (S1, S2, S3, S4). In each graph, the upper surface corresponds to the decoding performance and VAF of the space-by-time decomposition as a function of the number of spatial and temporal modules. The lower surface represents significance levels for VAF and decoding values, computing as the maximum decoding and VAF values obtained from a permutation test where synergies were extracted from a random shuffling of the EMG data matrix across muscles.

