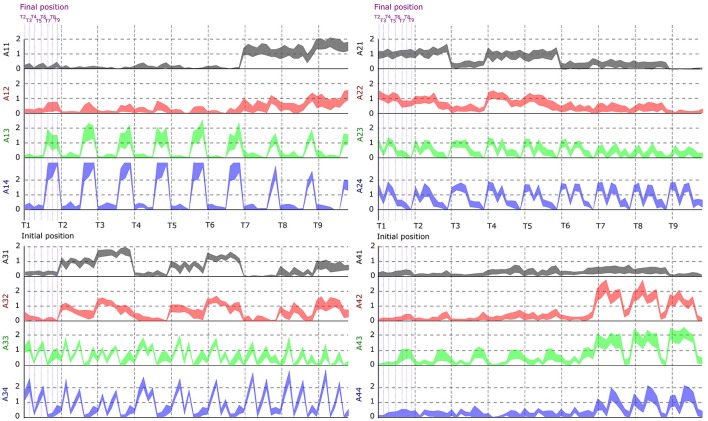
Figure 6.
Dependence of the activation coefficients on the initial and final posture. Each graph represents the value of an ai, j coefficient as a function of the initial position (from T1 to T9; gray-dotted vertical bars) and the final position (from T1 to T9; violet-dotted vertical bars), with i being the number associated to temporal modules (from 1 to 4) and j to spatial modules (from 1 to 4). Each panel represents one temporal module (1-left up, 2-right up, 3-left down, 4-right down), each color one spatial module (1-gray, 2-red, 3-green, 4-blue). Results are shown for the data of subject S2.

