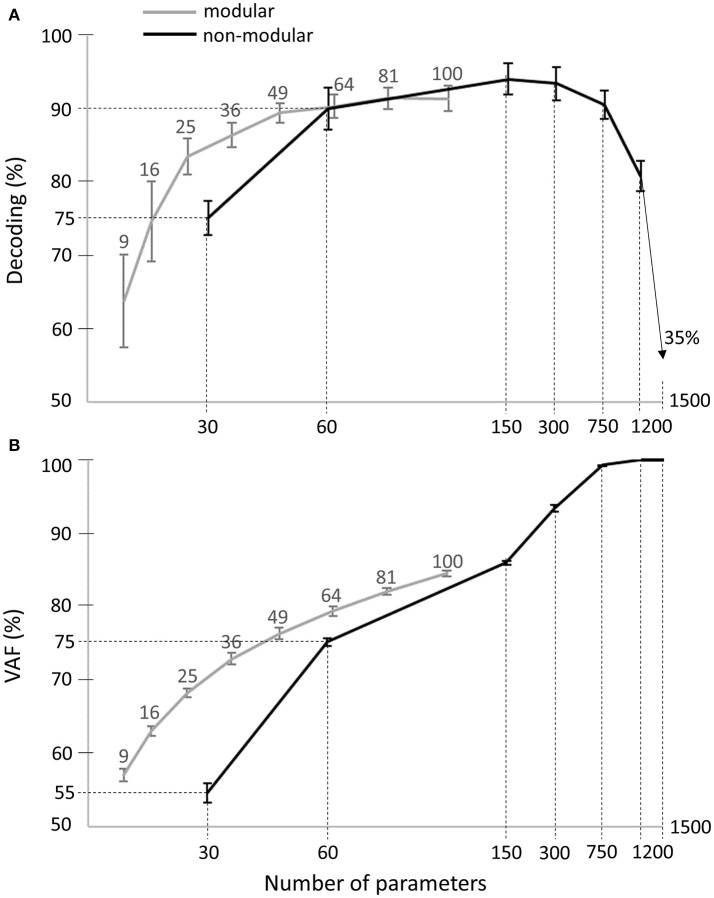
Figure 8.
Comparison of decoding performance (A) and VAF (B) as a function of the number of single-trial parameters between the modular and non-modular decompositions. Gray lines represent the average decoding performance and VAF across subjects of the modular decomposition using 3, 4, 5, 6, 7, 8, 9, and 10 temporal and spatial modules, which correspond to a total of 9, 16, 25, 36, 49, 64, 81, and 100 single-trial parameters respectively (top gray x-axis). Black lines represent the average decoding performance and VAF across subjects of the non-modular decomposition. As single-trial parameters of the non-modular decomposition, we used the rms values of the EMG signals of all (30) muscles binned in 1, 2, 5, 10, 25, 50 temporal windows, which corresponds to a total of 30, 60, 150, 300, 750, 1,500 single-trial parameters respectively (bottom x-axis).

