Figure 2.

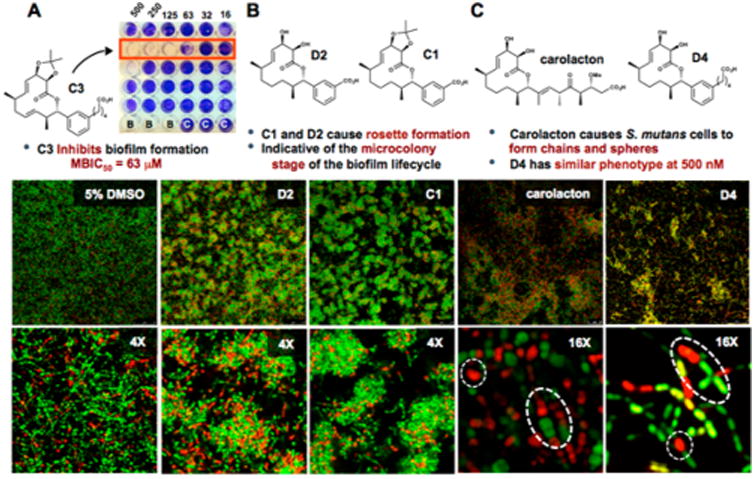
Carolacton analogs elicit a range of phenotypic responses. (A) C3 inhibits biofilm formation with an MBIC50 of 63 μM, “B” = Blank wells; “C” = S. mutans control. (B) Confocal microscopy highlights the effect of C1 and D2 on the growth of S. mutans biofilm at 500 μM (top, field view; bottom, 4× zoom). (C) Carolacton and D4 (top, field view; bottom, 16× zoom) display similar phenotypes at 500 nM. White circles indicate spherical cell morphology and ovals highlight chains of cells. See Figures S3 and S4 for additional representative images.
