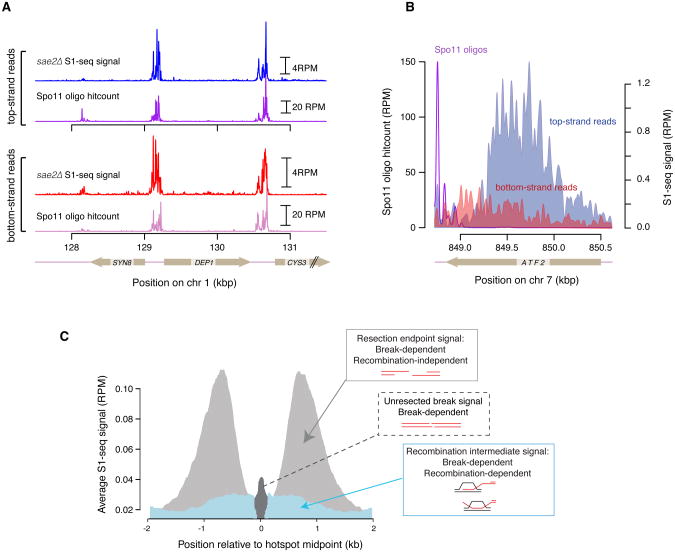
Figure 4.
Adaptations of S1-seq: A. S1-seq in a sae2Δ background can reveal unresected Spo11 DSBs that correlate well with DSBs mapped by traditional Spo11-oligo sequencing. B. A snapshot of top- and bottom-strand S1-seq reads on the right side of a Spo11 hotspot. The most abundant top-strand reads represent resection endpoints whereas the bottom-strand signal originates from RIs. C. A graphical representation of the different species detected by S1-seq around hotspots: resection endpoints (light gray), RIs (blue), and unresected DSBs (dark gray). Adapted from Mimitou, Yamada, & Keeney, 2017.

