. 2018 Mar 26;11(3):363–367. doi: 10.14202/vetworld.2018.363-367
Copyright: © Sabrina, et al.
Open Access. This article is distributed under the terms of the Creative Commons Attribution 4.0 International License (http://creativecommons.org/licenses/by/4.0/), which permits unrestricted use, distribution, and reproduction in any medium, provided you give appropriate credit to the original author(s) and the source, provide a link to the Creative Commons license, and indicate if changes were made. The Creative Commons Public Domain Dedication waiver (http://creativecommons.org/publicdomain/zero/1.0/) applies to the data made available in this article, unless otherwise stated.
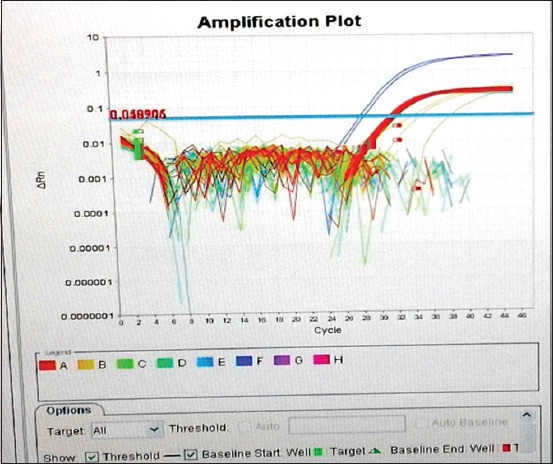
Figure-2.

Logarithmic amplification curve of all samples (all plates even positive and negative controls).
