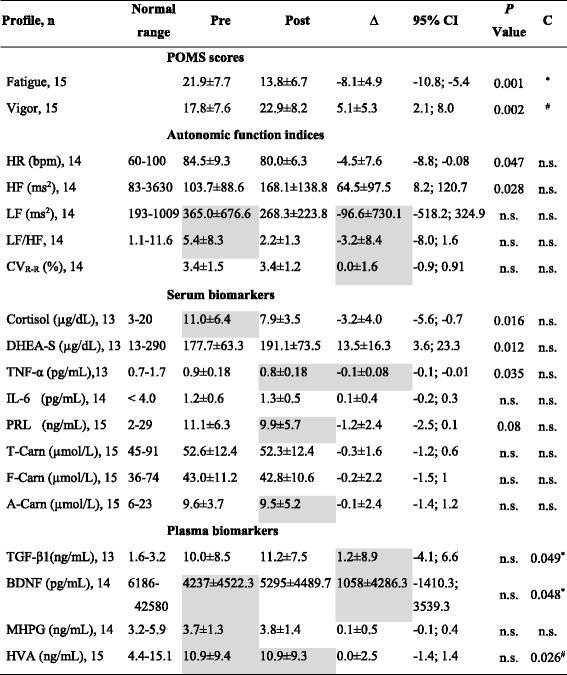
Table 1.
Changes in POMS scores, autonomic function indices, and blood biomarkers following a sitting isometric yoga session

n: Sample size
Values are mean ± standard deviation
Pre: Mean values before yoga sessions
Post: Mean values after yoga sessions
∆: The mean difference between Pre and Post values, i.e. Post value – Pre value
P value: Paired t-test or Wilcoxon signed-rank test between Pre and Post values
95% CI: 95% Confidence interval (Lower bound – Upper bound)
C: Correlations
*: Correlation between ∆ F and ∆ plasma/serum components, P < 0.05
#: Correlation between ∆ V and ∆ plasma/serum components, P < 0.05
n.s.: not significant
Highlighted in gray: The probability of normal distribution is violated by Kolmogorov-Smirnov test
