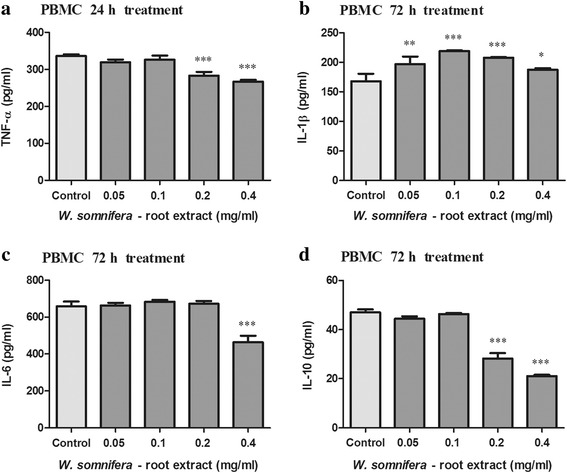
Fig. 3.

Concentration of TNF-α (a), IL-1β (b), IL-6 (c) and IL-10 (d) in LPS stimulated and WRE treated PBMC’s (Values expressed as mean ± SD, *p < 0.05, *** p < 0.0001, compared to the control)

Concentration of TNF-α (a), IL-1β (b), IL-6 (c) and IL-10 (d) in LPS stimulated and WRE treated PBMC’s (Values expressed as mean ± SD, *p < 0.05, *** p < 0.0001, compared to the control)