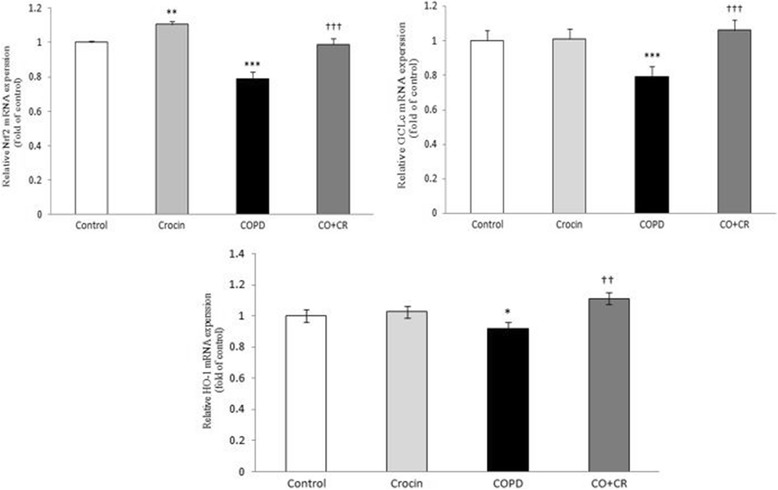
Fig. 12.

Nrf2, HO-1 and GCLc mRNA expression in lung tissue of Control, Crocin, COPD and COPD plus crocin (CO + CR) rats. *P < 0.05,***P < 0.01 vs. Control rats. ††P < 0.01, †††P < 0.05 vs. the COPD group. All the groups were statistically compared by ANOVA followed by Tukey’s multiple comparison. Data are expressed as mean ± SEM
