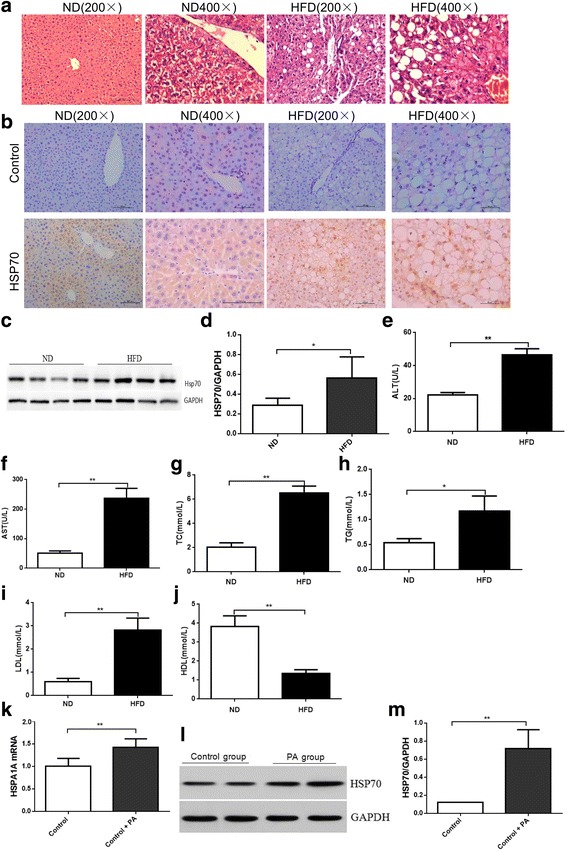
Fig. 1.

Hsp70 expression in the liver and in HepG2 cells. Histopathological changes in the livers of mice in the ND group and HFD group (a HE staining, original magnification × 200; × 400). Hsp70 expression in each group. HSP70 expression increased and localized to the cell nucleus in the HFD group compared with the control group (b-c). HSP70 protein expression clearly increased in the HFD group compared with the ND group (P < 0.05). Effects of high fat on HepG2 cells. Oil Red O staining after 24 h of treatment indicates the presence of few lipid droplets in the control group, whereas there were many lipid droplets in the PA-treated group (d original magnification × 200; × 400). In HepG2 cells, HSP70 mRNA and protein expression clearly increased in the PA group compared with the control group (P < 0.05). HSP70 mRNA (e) and protein (f) expression levels were evaluated by qPCR and Western blot and normalized to GAPDH levels. Data are expressed as the mean ± SD (n = 6, each). Blood samples were then collected, and the levels of ALT (e), AST (f), TC (g), TG (h), LDL (i), and HDL (j) in the plasma were determined. Data represent the mean from six animals, and error bars indicate the SD. *P < 0.05 compared with the control group, ** P < 0.01 compared with the control group
