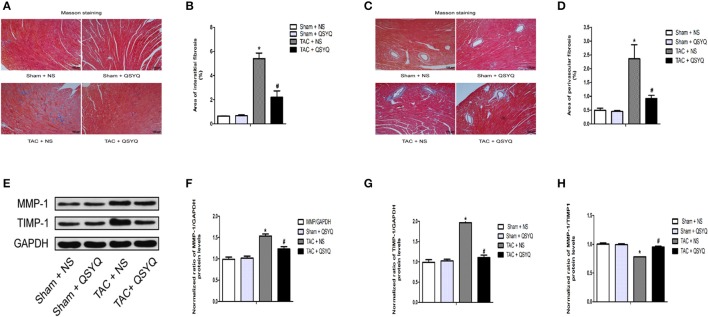
Figure 3.
QSYQ attenuated cardiac fibrosis in TAC mice. (A) Representative photographs of sections of left ventricles with Masson trichrome staining in the Sham + NS, Sham + QSYQ, TAC + NS, and TAC + QSYQ groups 8 weeks after TAC. Blue staining indicates interstitial fibrosis. (B) Quantitative analysis of interstitial fibrosis in the four groups. (C) Representative photographs of sections of left ventricles with Masson trichrome staining in the four groups. Blue staining indicates perivascular fibrosis. (D) Quantitative analysis of perivascular fibrosis in the four groups. (E) Representative immunoblots for MMP-1 and TIMP-1 in the heart. (F–H) Quantitation of protein levels of MMP-1 and TIMP-1 in the heart. *P < 0.05 vs. Sham + NS group; #P < 0.05 vs. TAC + NS group; data shown are means ± SEM (n = 6 per group).

